Bathroom 2048spp
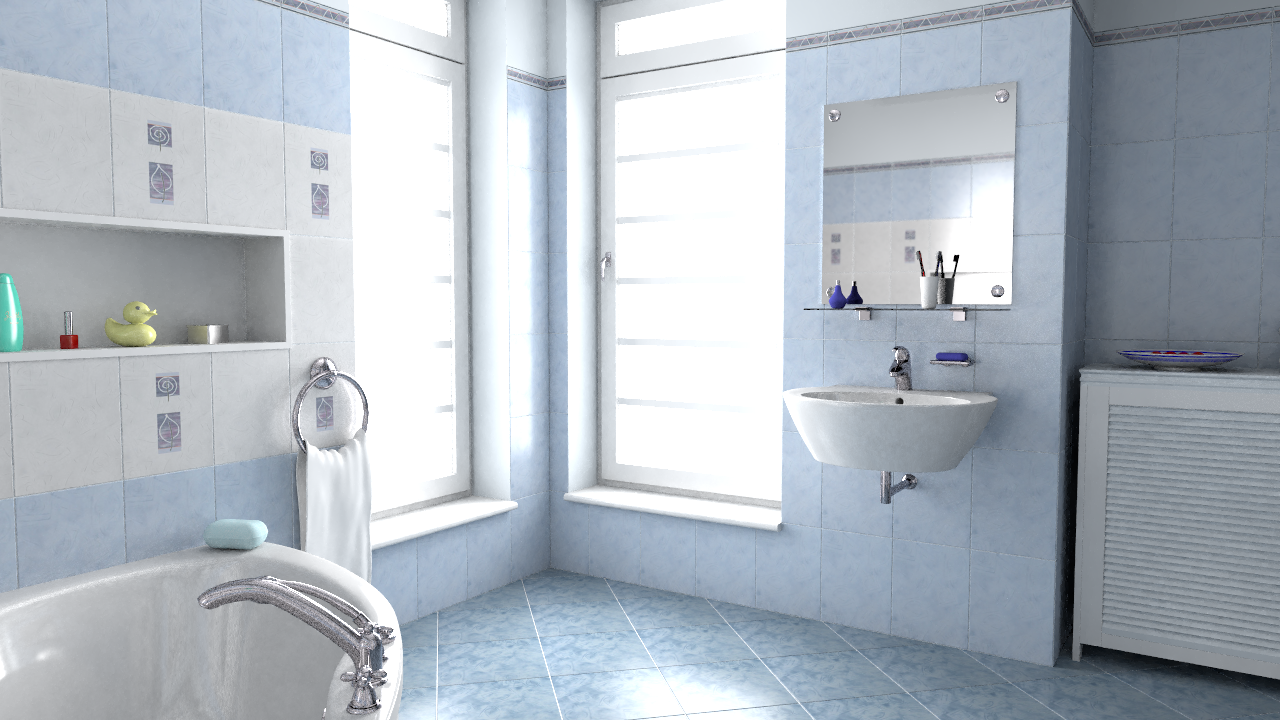
|
G-PT L1  relMSE: 0.001998 PT (4096spp) 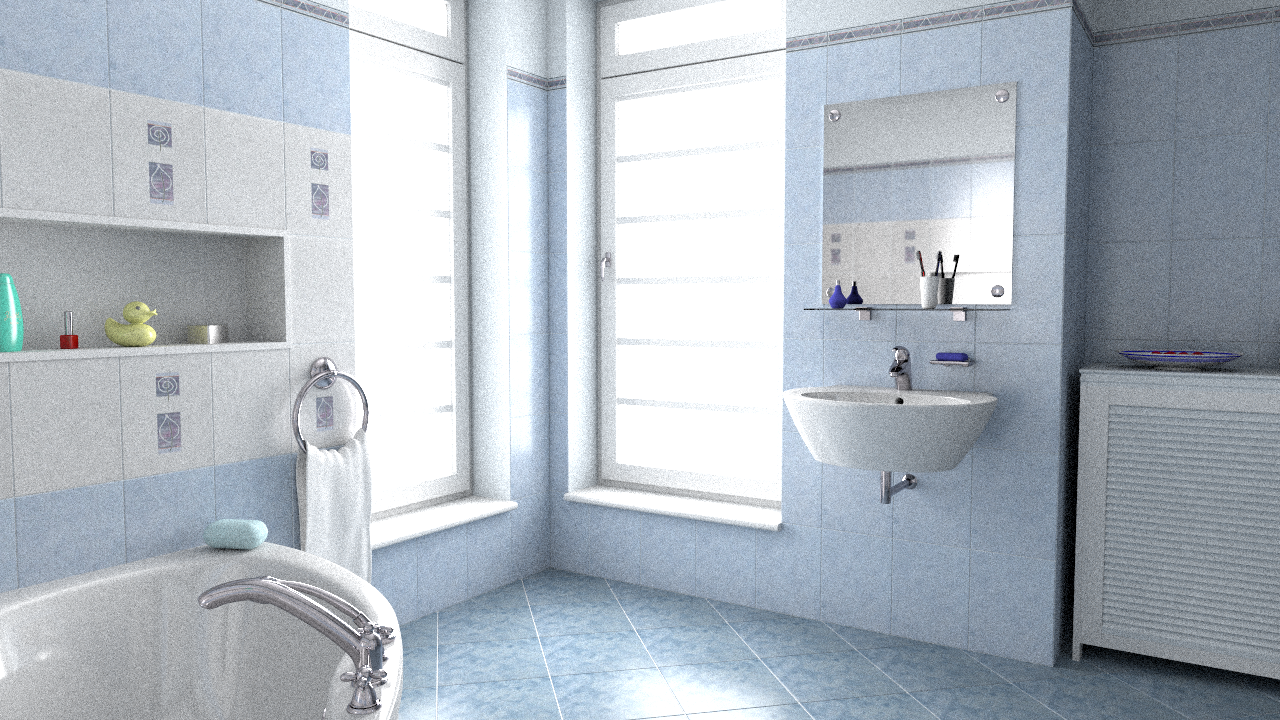 relMSE: 0.012233 |
G-PT L2 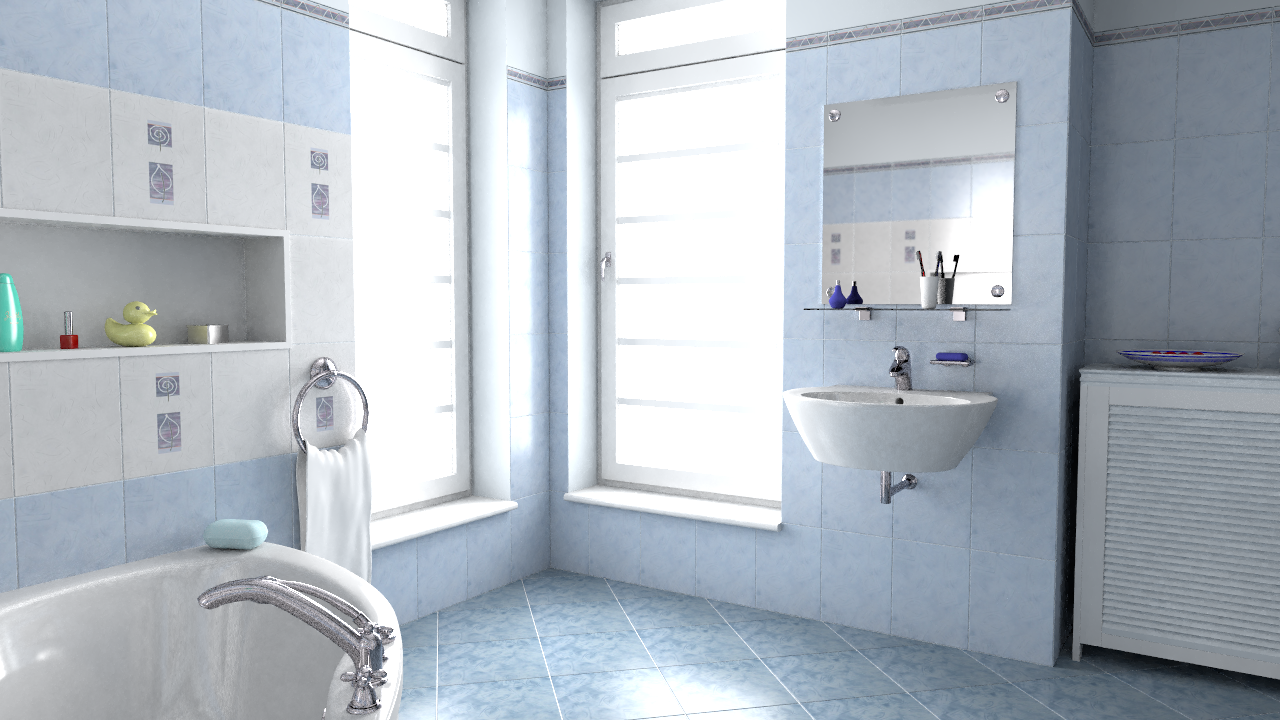 relMSE: 0.002095 Reference 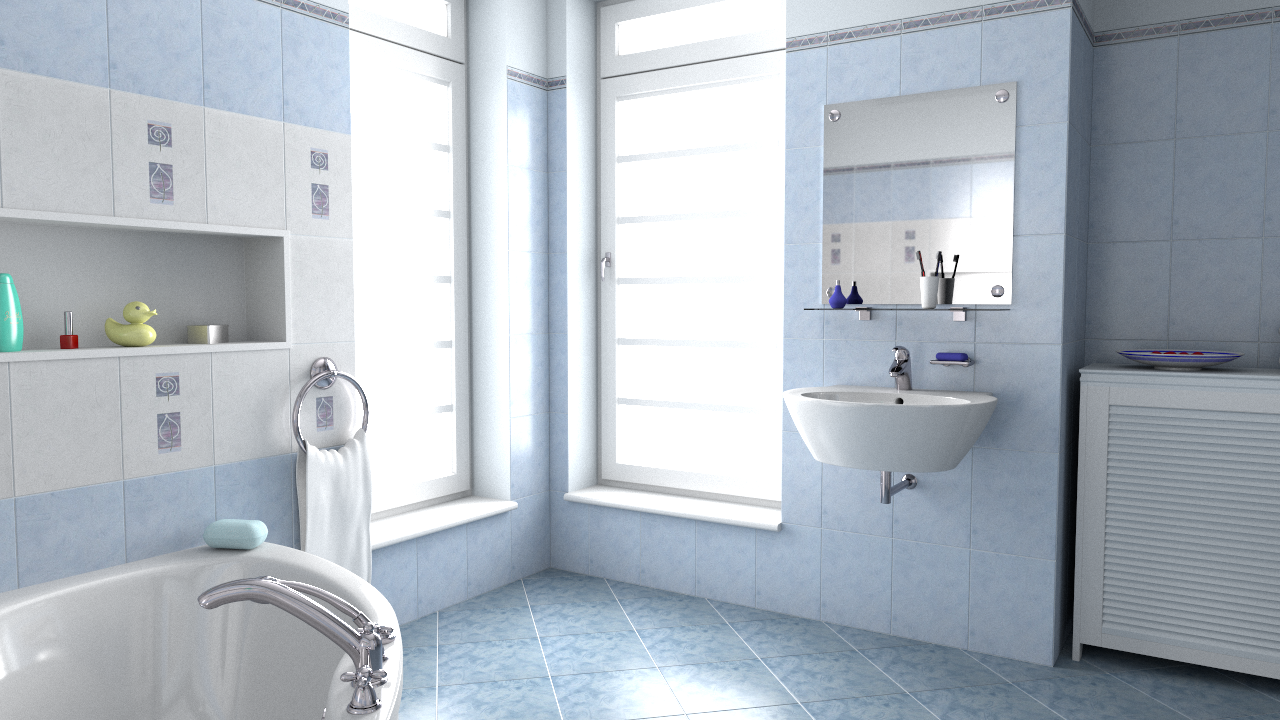 40000spp |
|---|
Bathroom 256spp
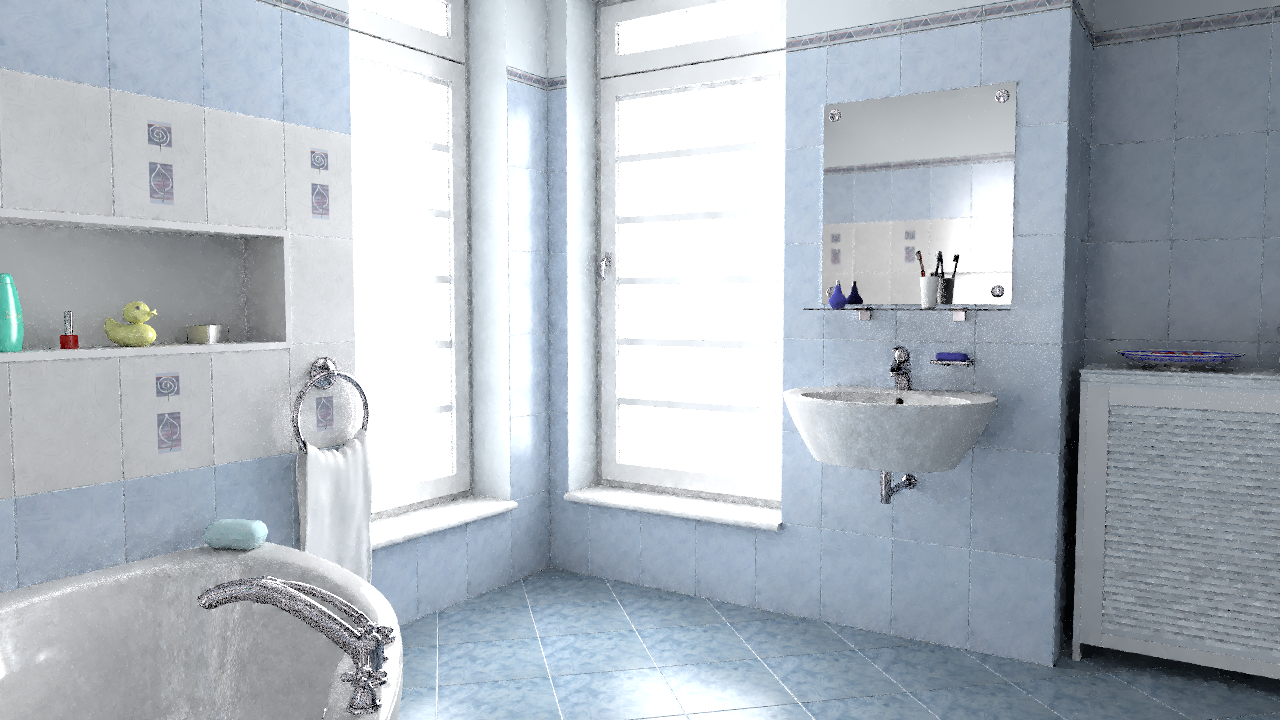
|
G-PT L1  relMSE: 0.009968 PT (512spp) 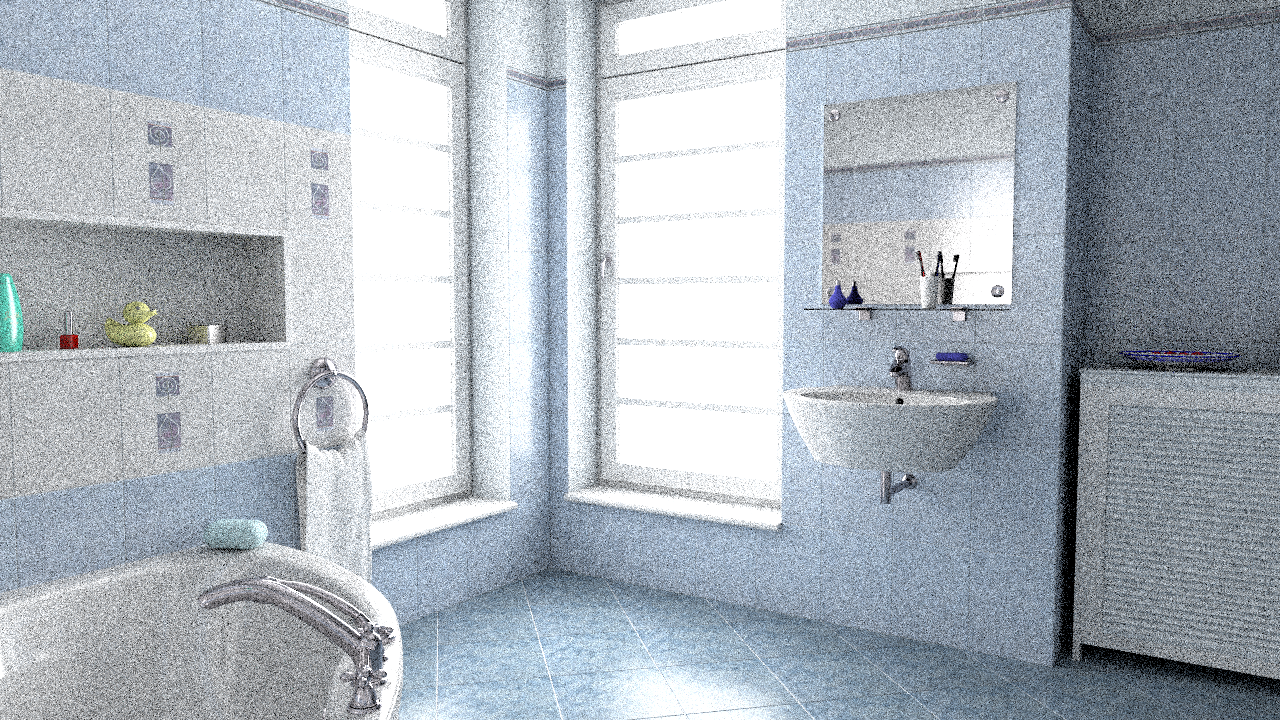 relMSE: 0.091963 |
G-PT L2 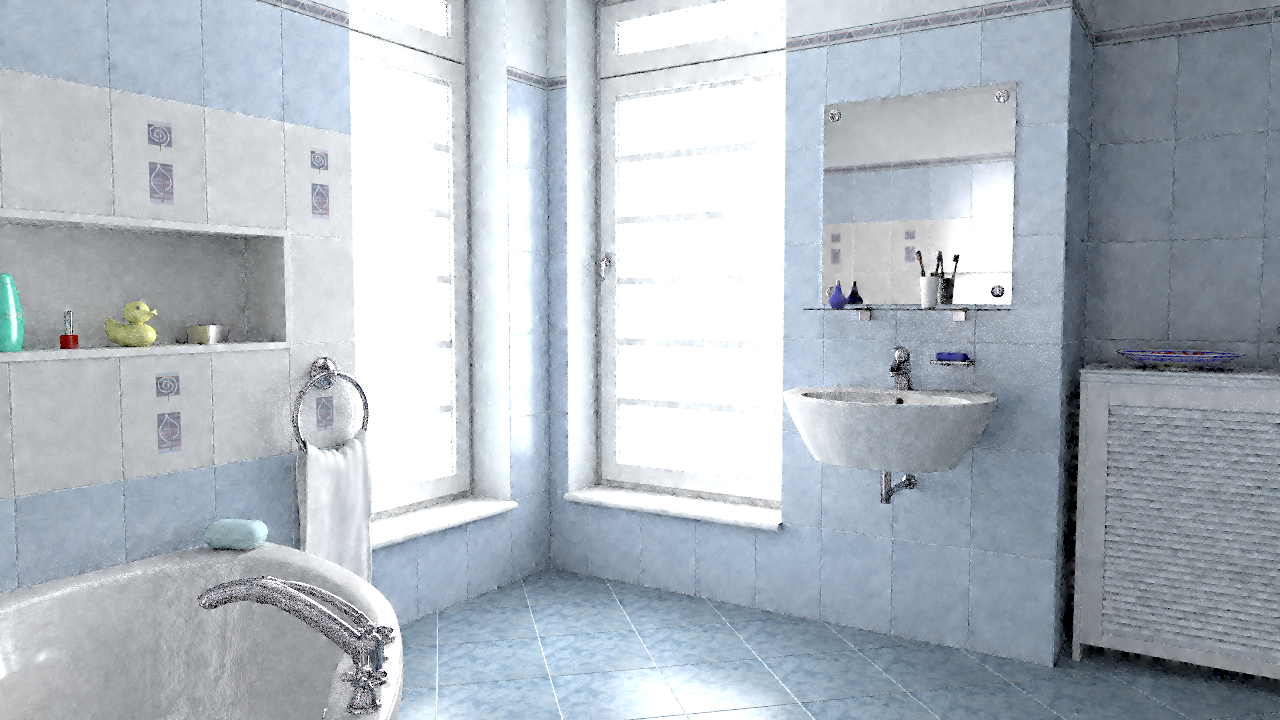 relMSE: 0.011023 Reference  40000spp |
|---|
Bookshelf 2048spp
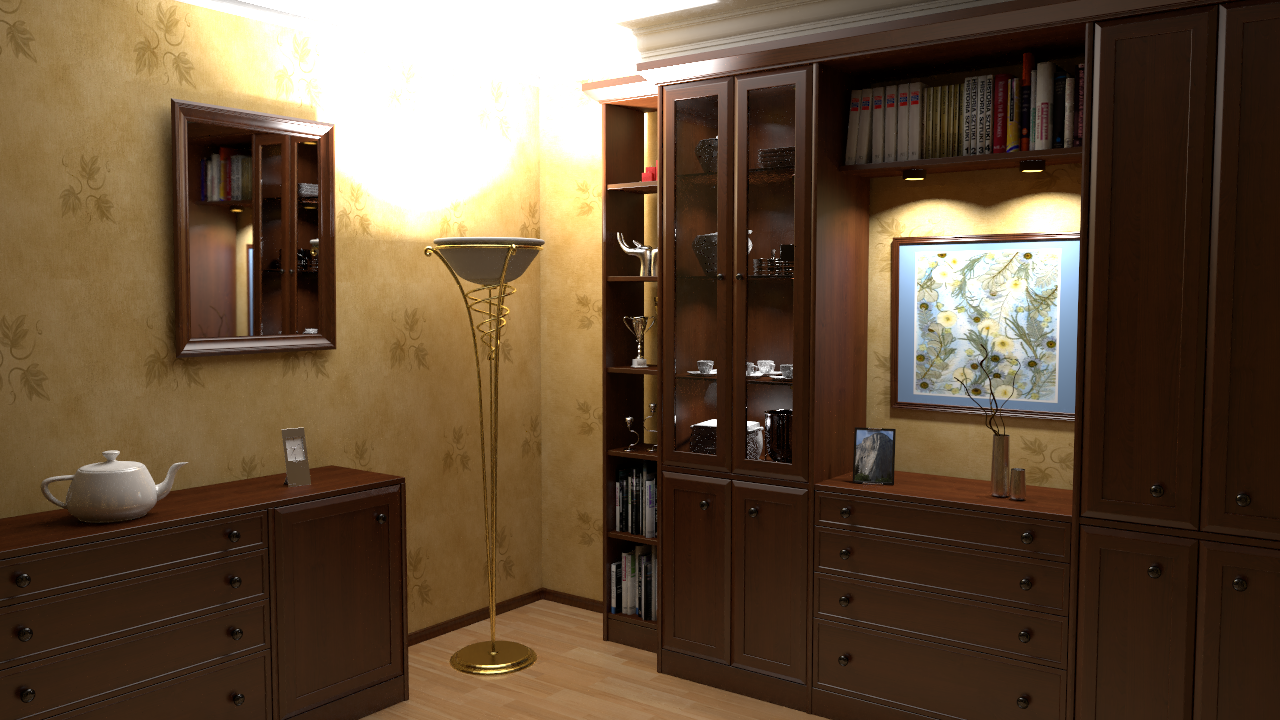
|
G-PT L1  relMSE: 0.000763 PT (4096spp) 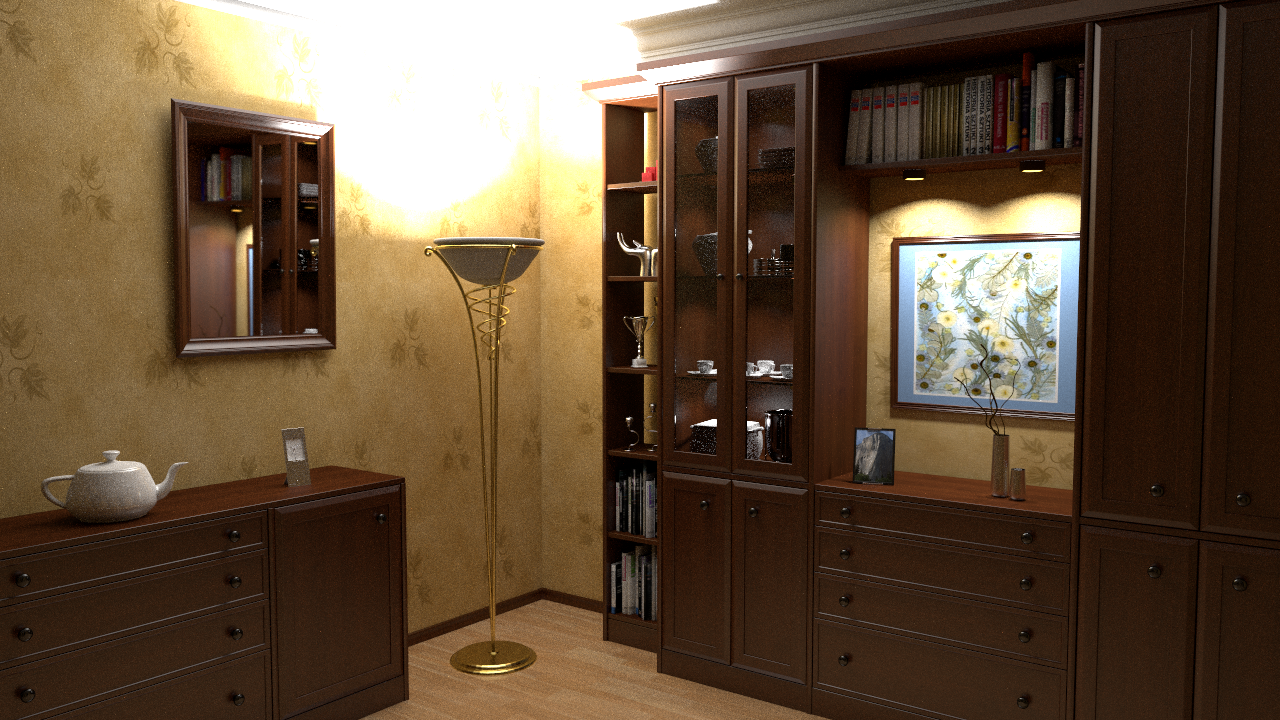 relMSE: 0.002943 |
G-PT L2 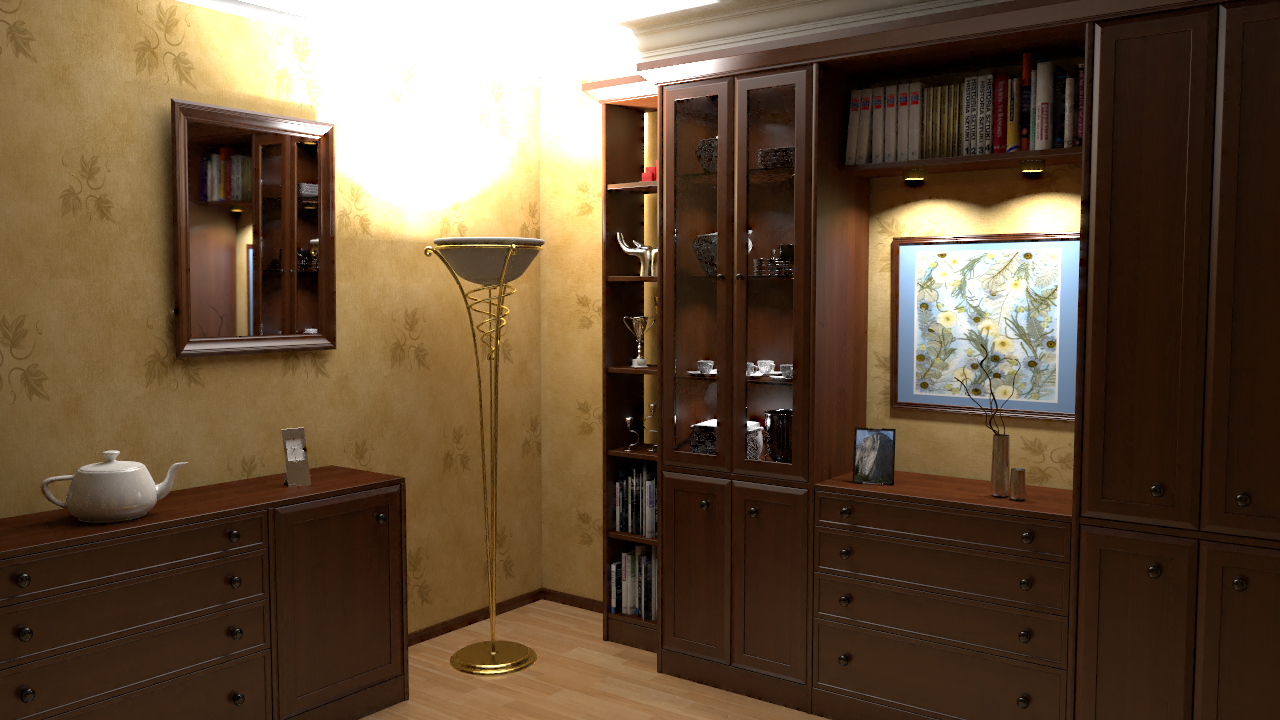 relMSE: 0.000887 Reference 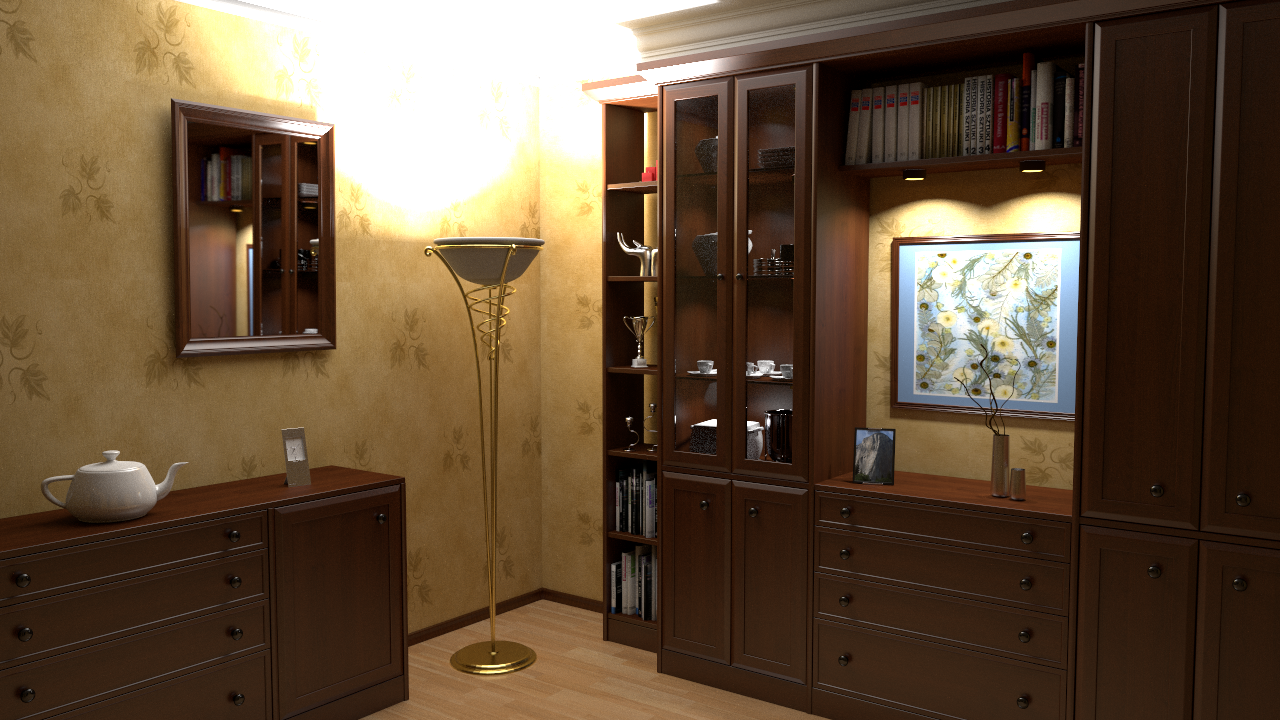 25000spp |
|---|
Bookshelf 256spp
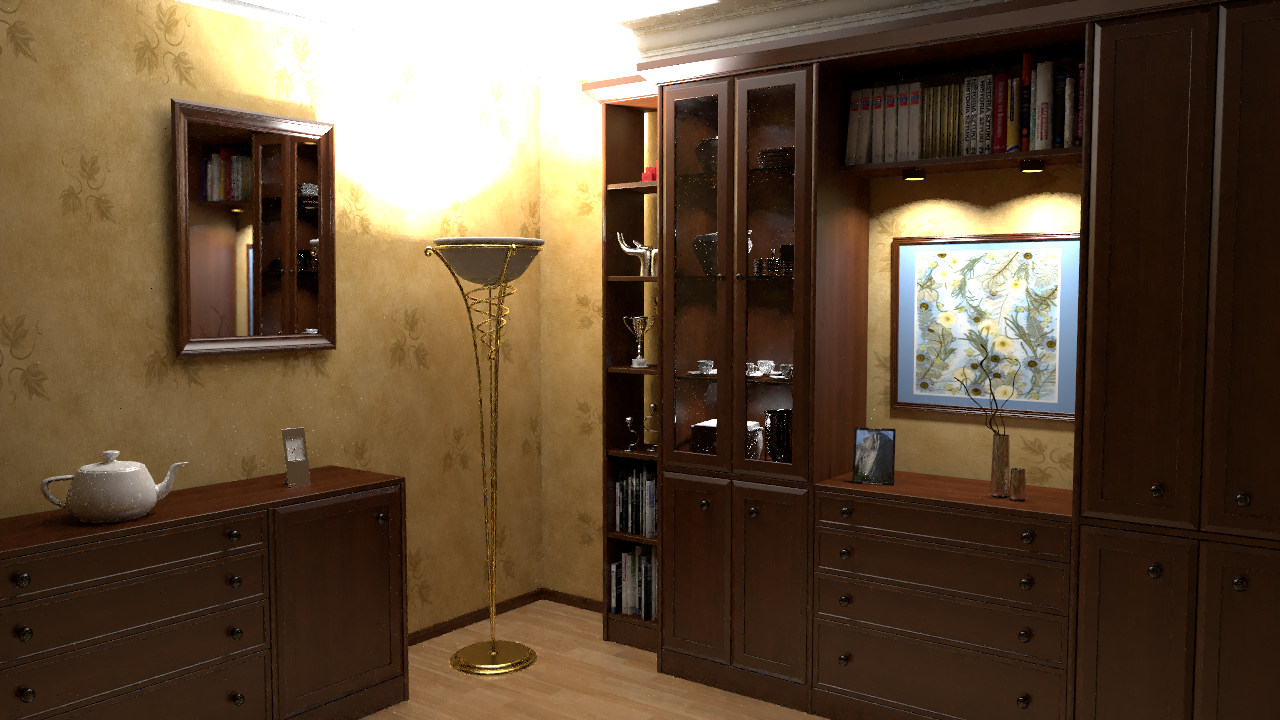
|
G-PT L1  relMSE: 0.003247 PT (512spp) 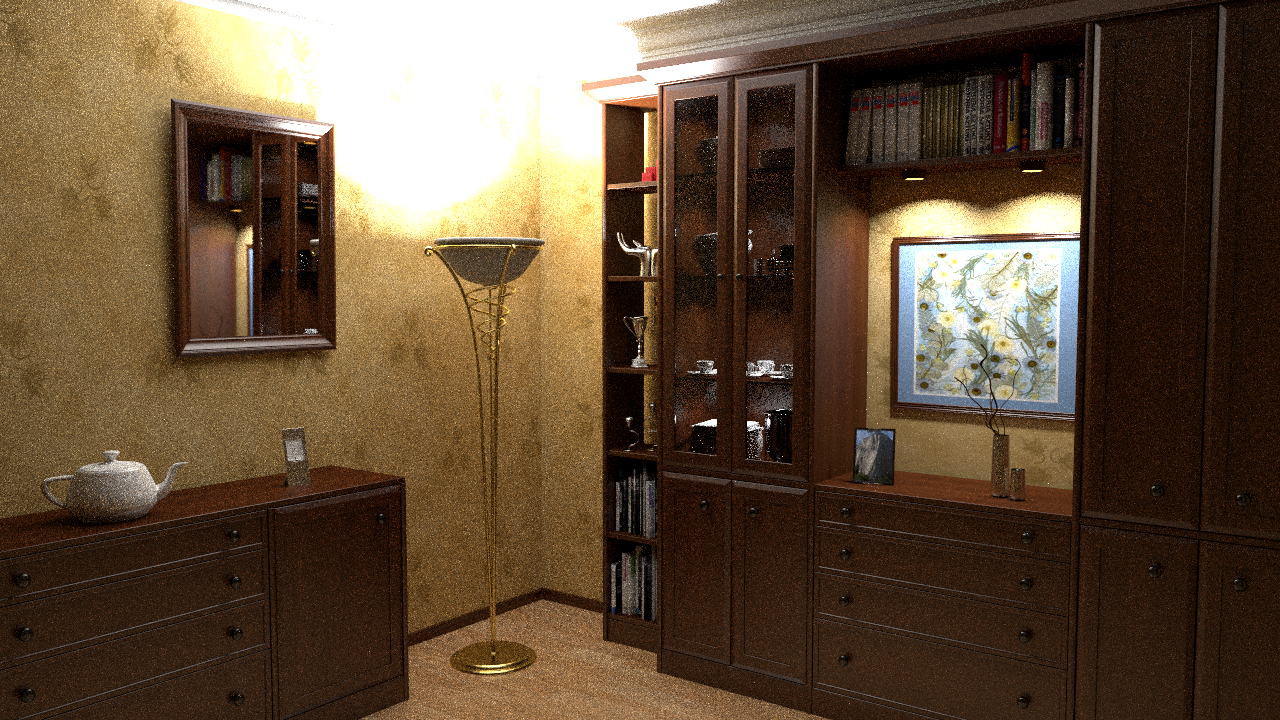 relMSE: 0.020531 |
G-PT L2 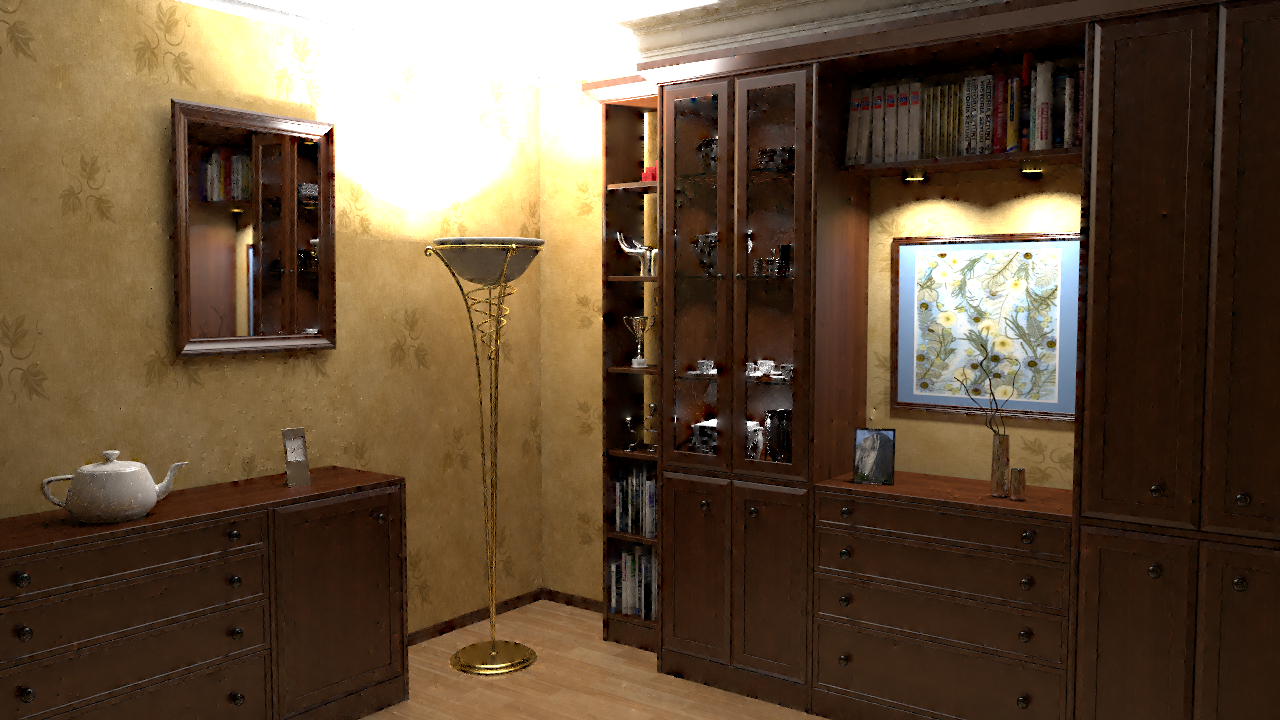 relMSE: 0.003965 Reference  18000spp |
|---|
Kitchen 2048spp

|
G-PT L1  relMSE: 0.001455 PT (4096spp) 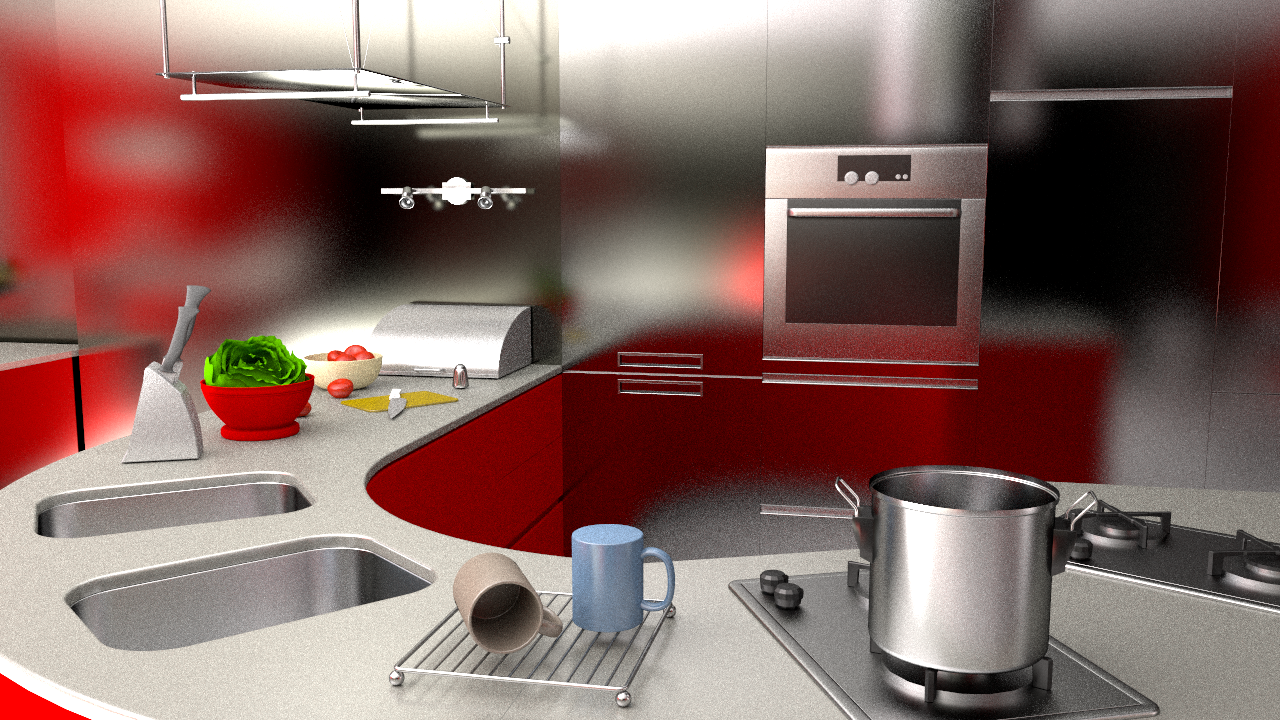 relMSE: 0.006881 |
G-PT L2  relMSE: 0.001701 Reference  32000spp |
|---|
Kitchen 256spp
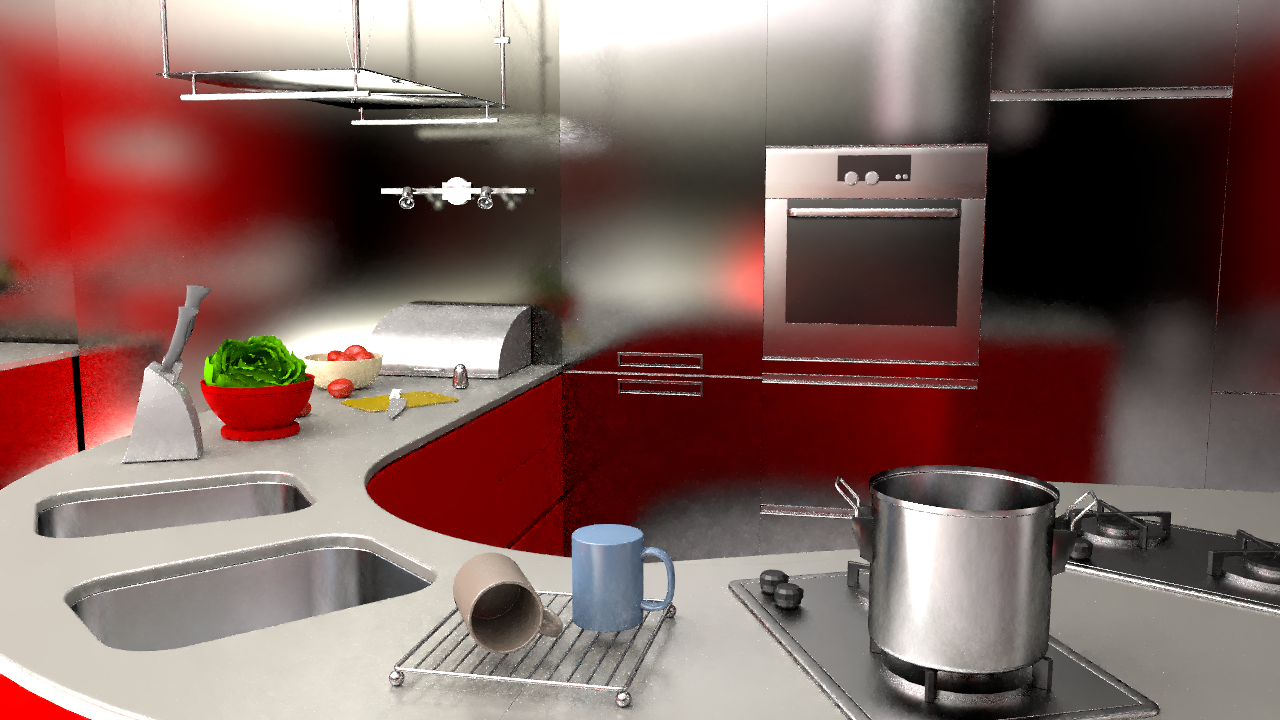
|
G-PT L1, 256spp  relMSE: 0.007584 PT, 512spp 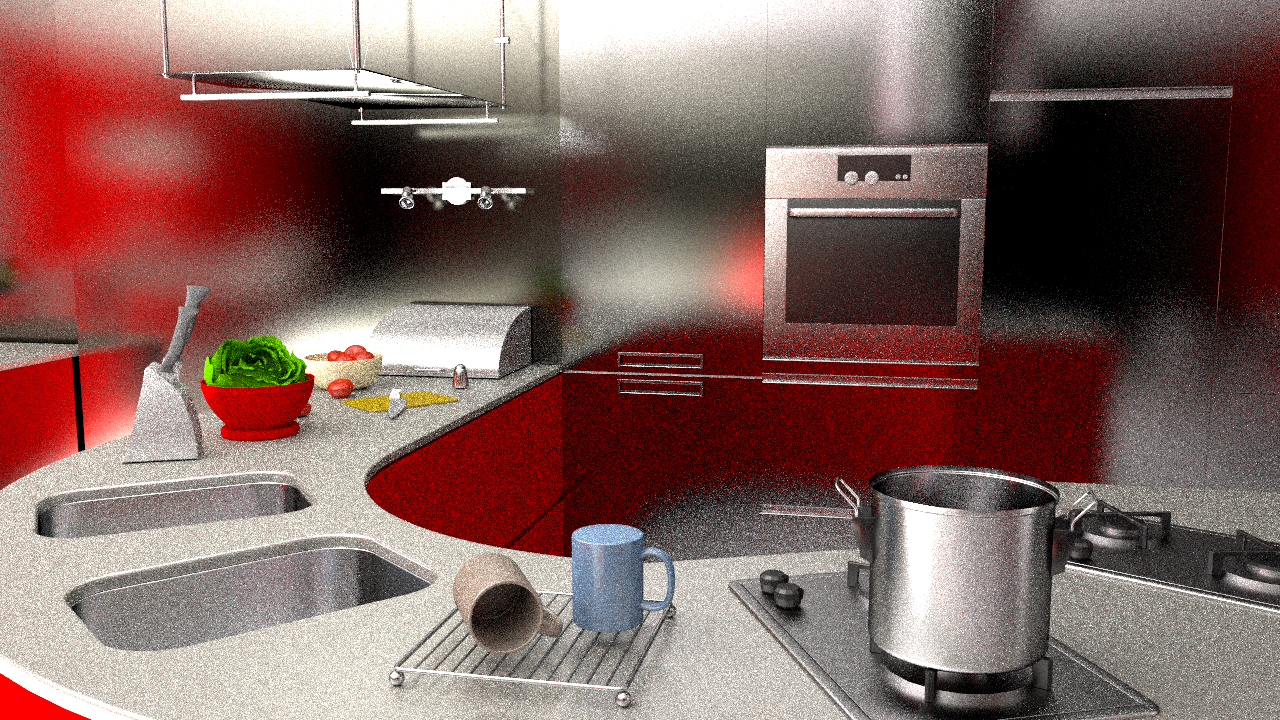 relMSE: 0.051185 |
G-PT L2, 256spp 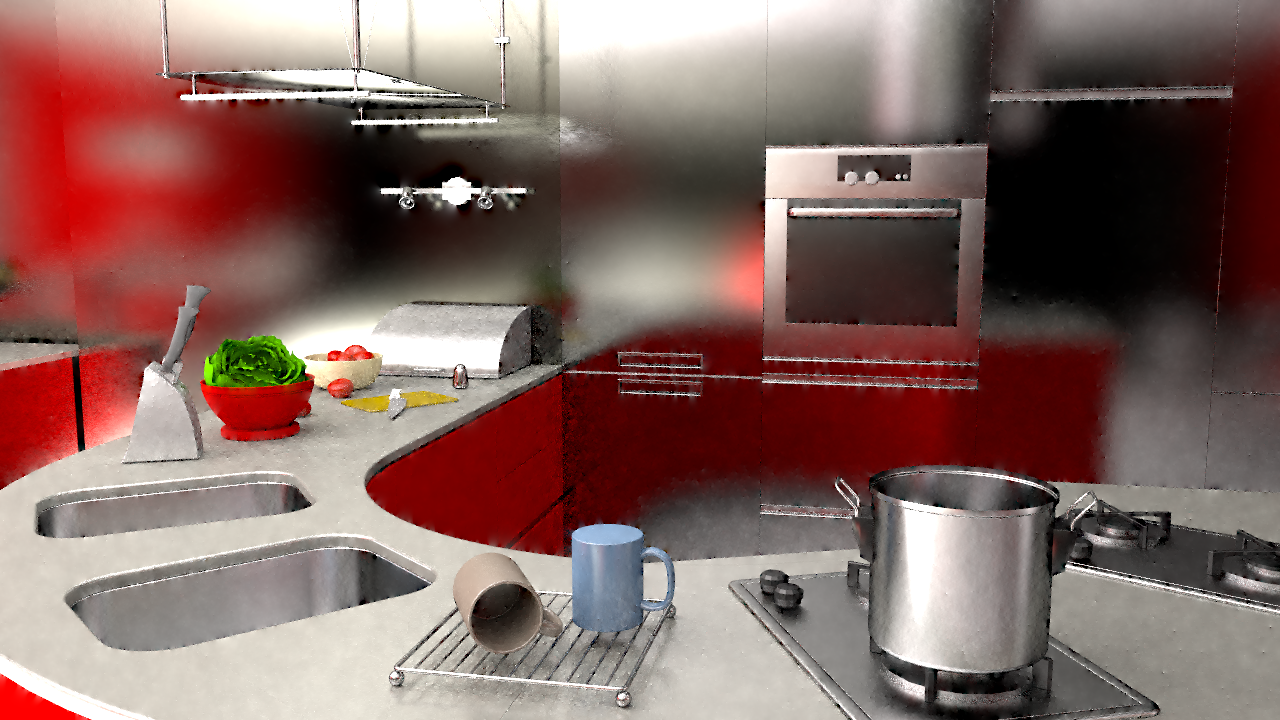 relMSE: 0.009138 Reference  32000spp |
|---|
Sponza 64spp
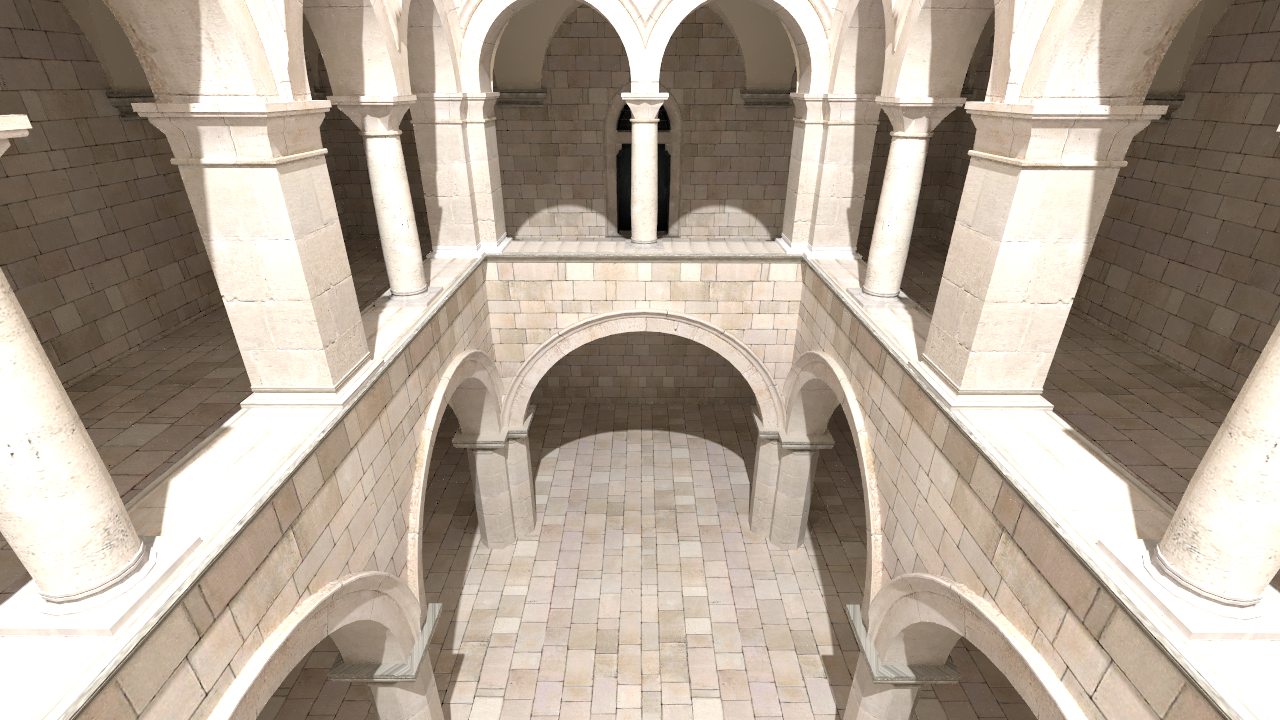
|
G-PT L1  relMSE: 0.000804 PT (128spp) 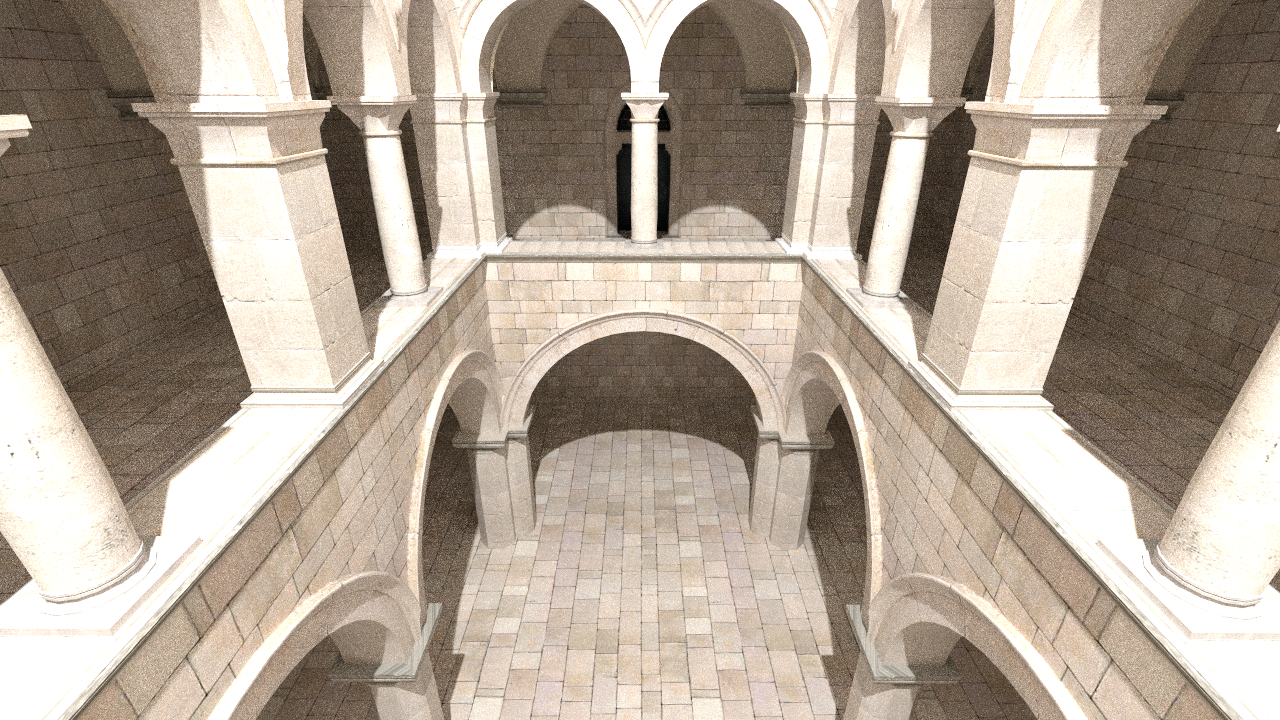 relMSE: 0.011792 |
G-PT L2 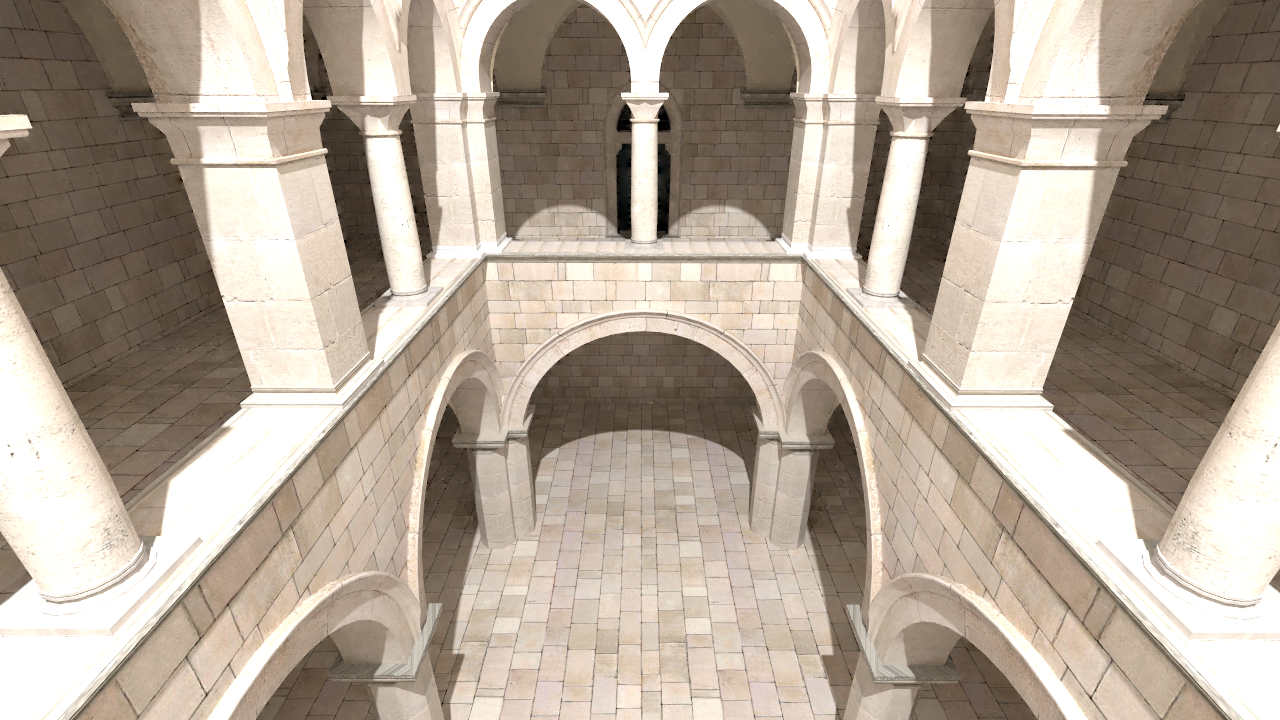 relMSE: 0.000888 Reference 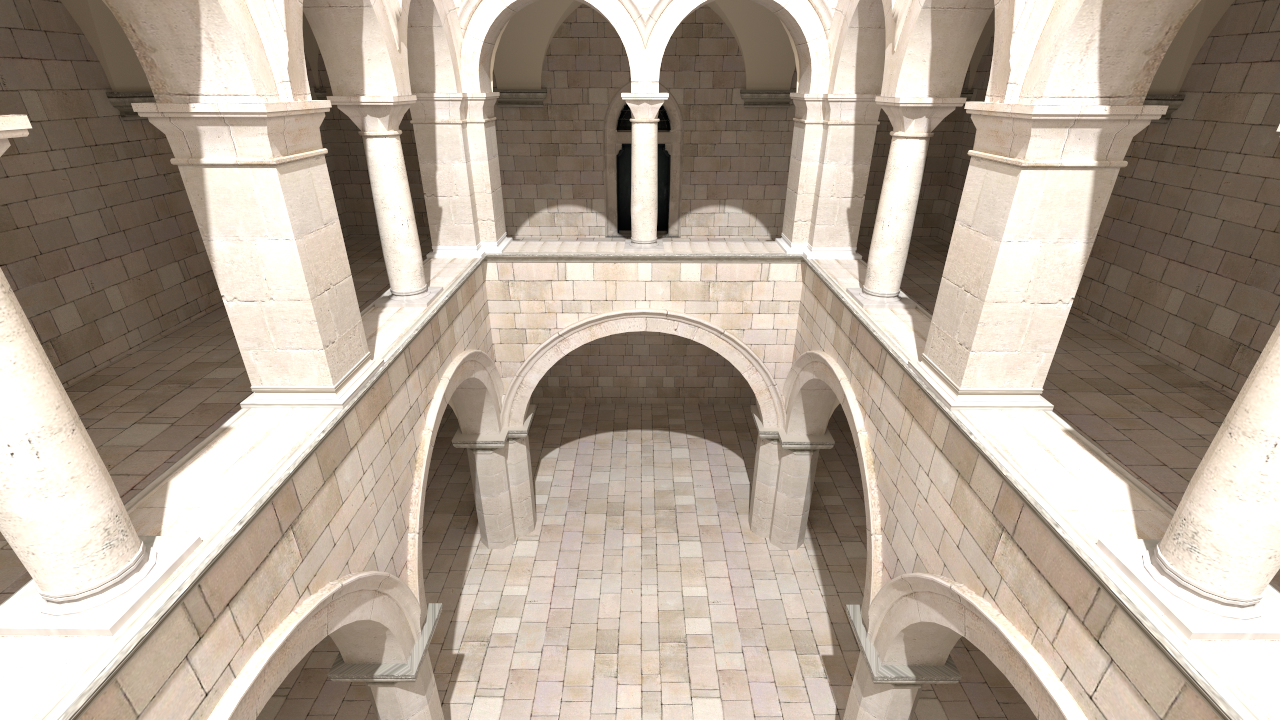 24000spp |
|---|
Sponza 8spp
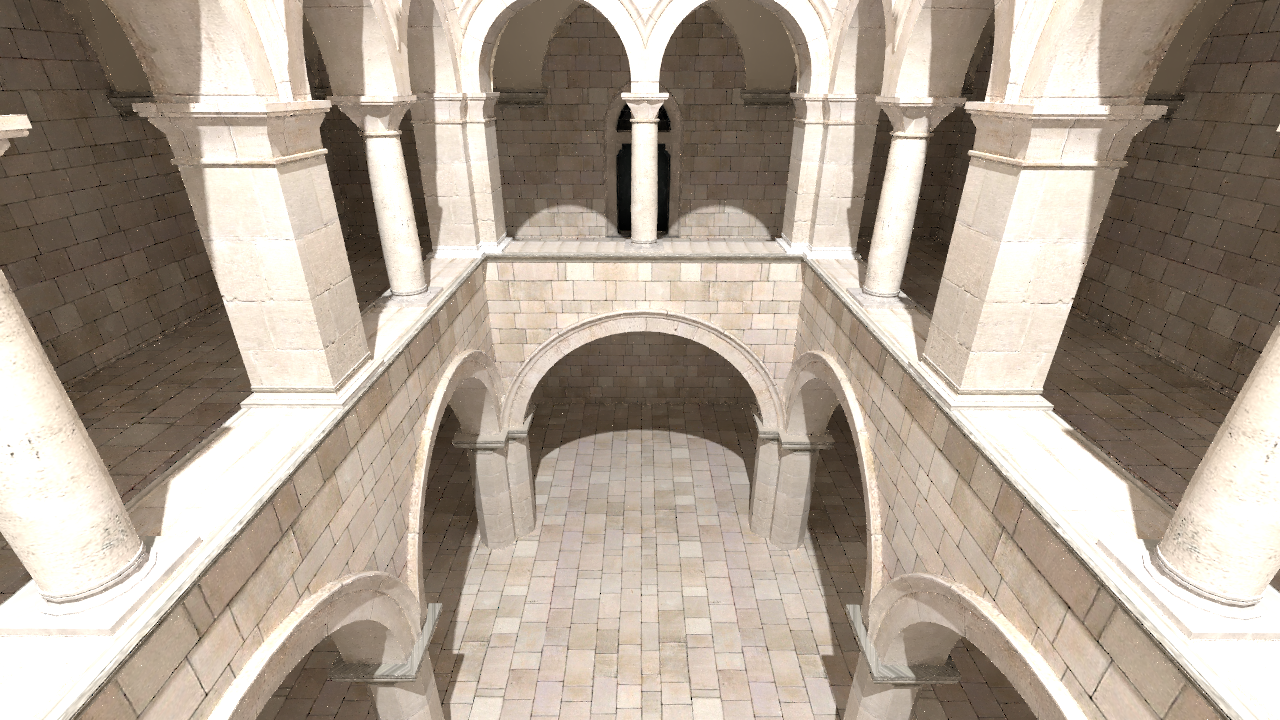
|
G-PT L1  relMSE: 0.006616 PT (16spp) 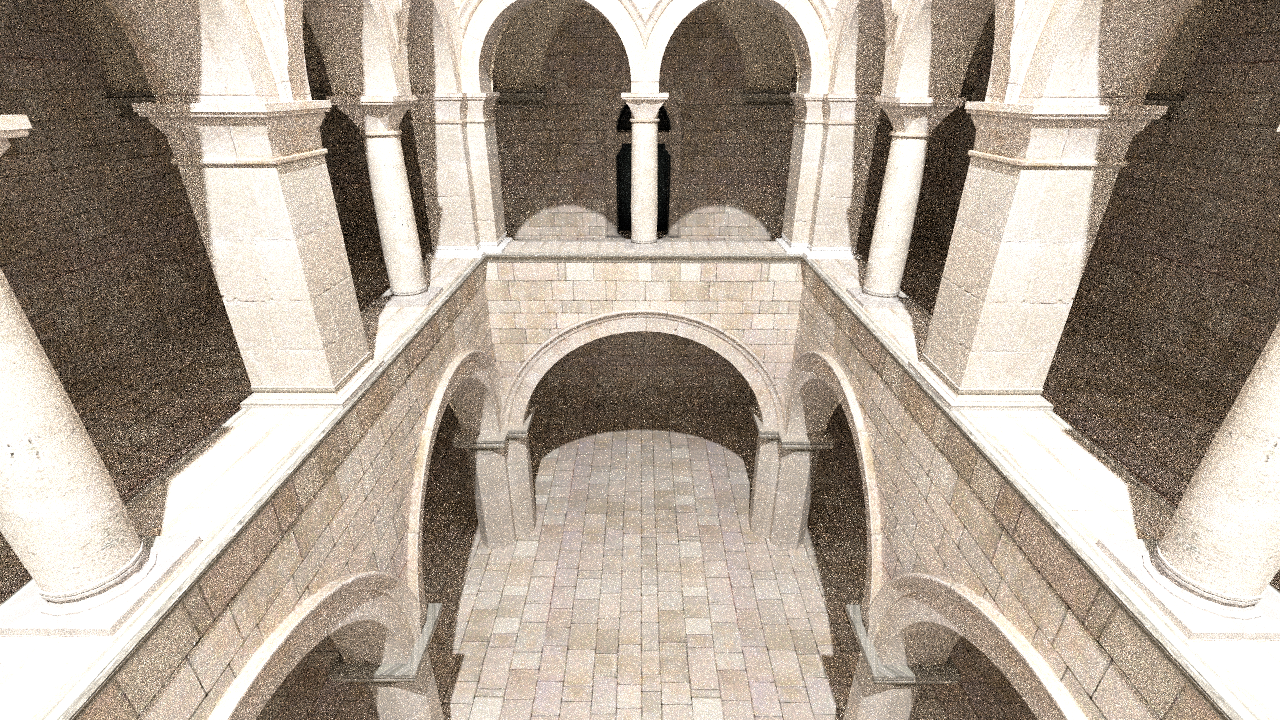 relMSE: 0.094282 |
G-PT L2 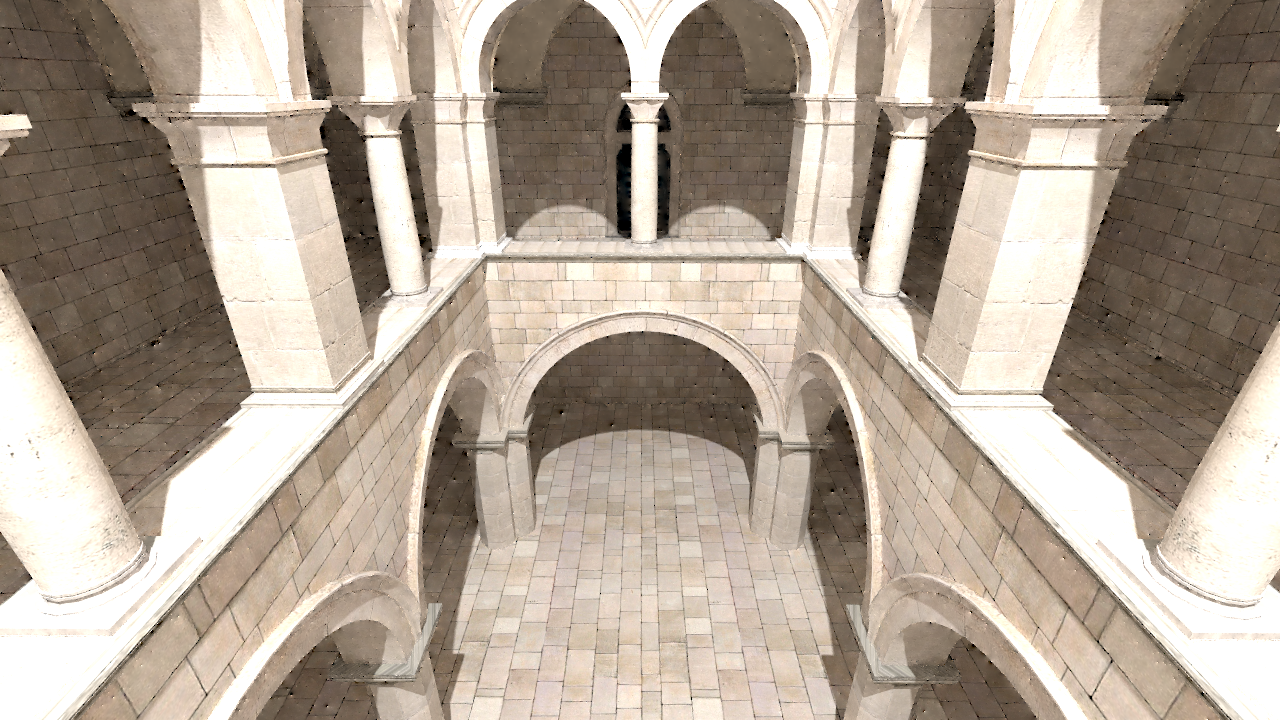 relMSE: 0.006455 Reference  24000spp |
|---|
Veach-Door 2048spp
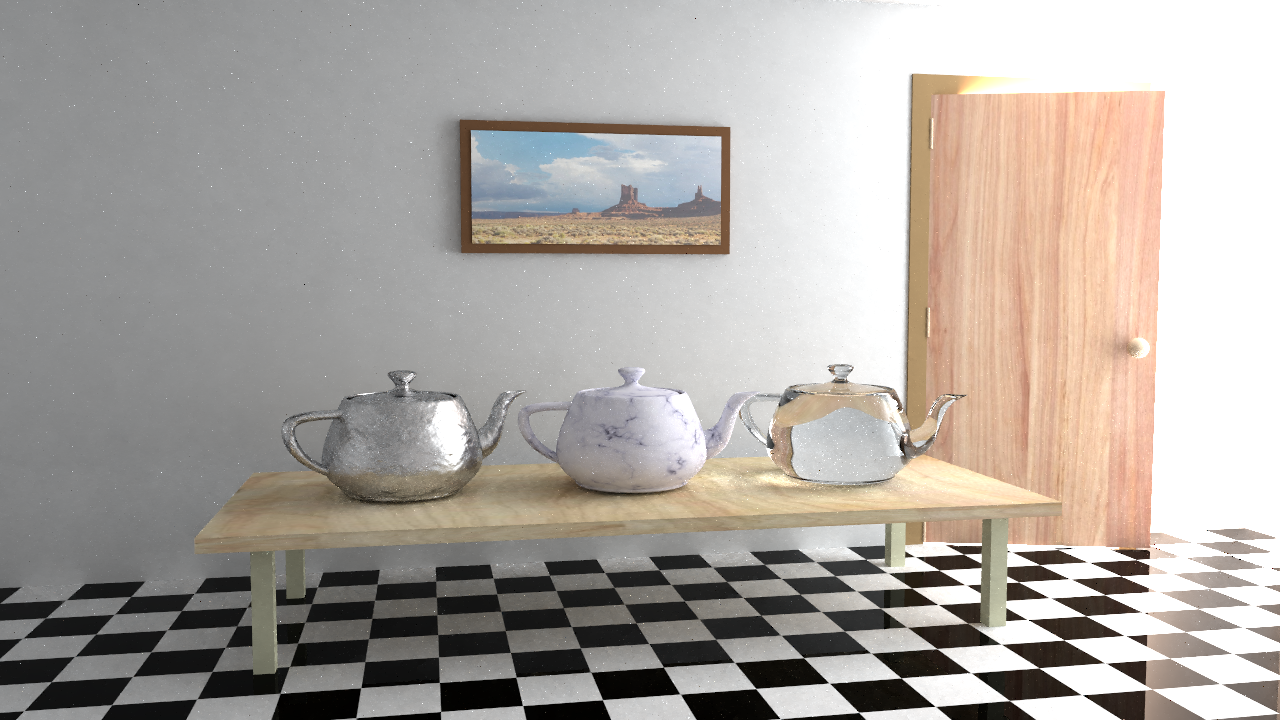
|
G-PT L1  relMSE: 0.004395 PT (4096spp) 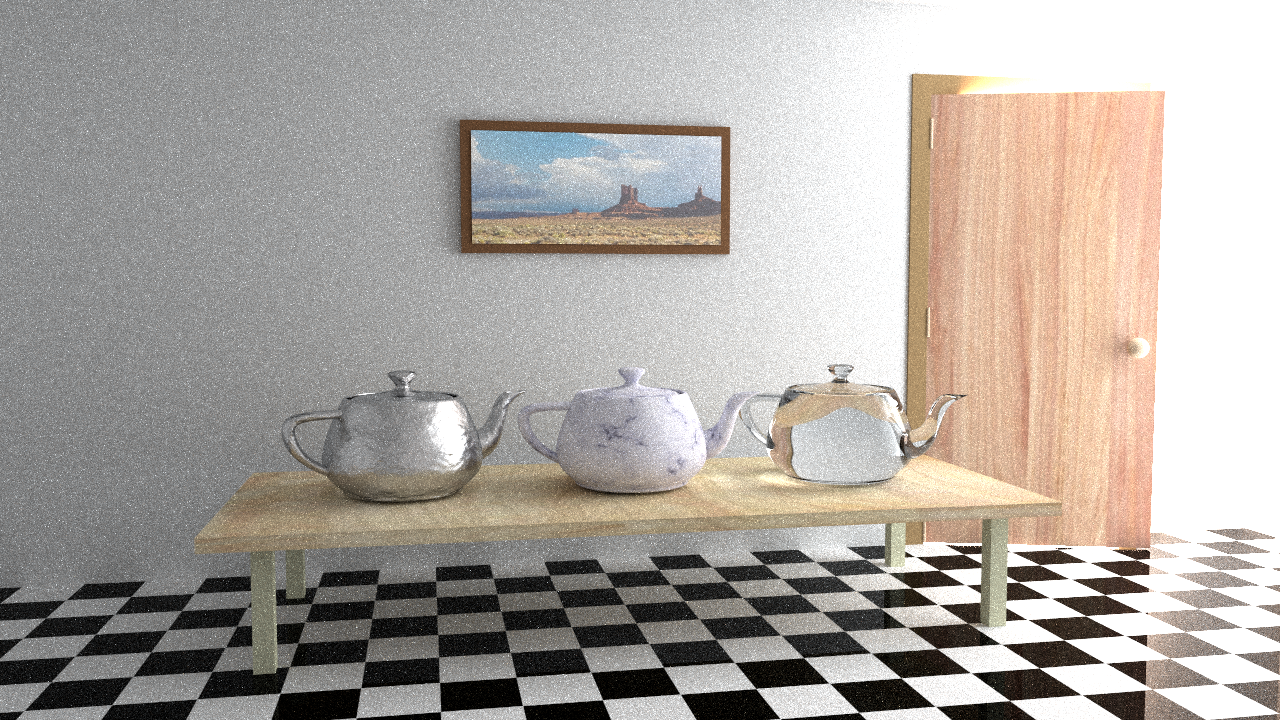 relMSE: 0.029148 |
G-PT L2 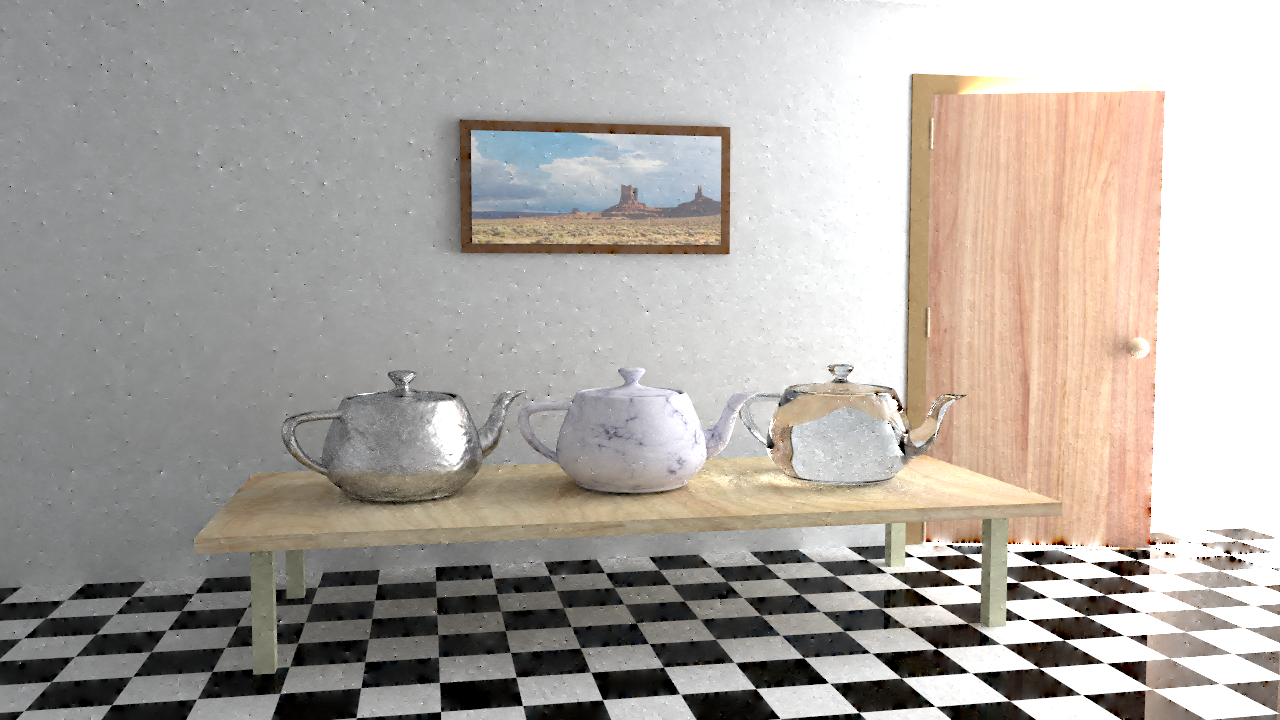 relMSE: 0.008662 Reference 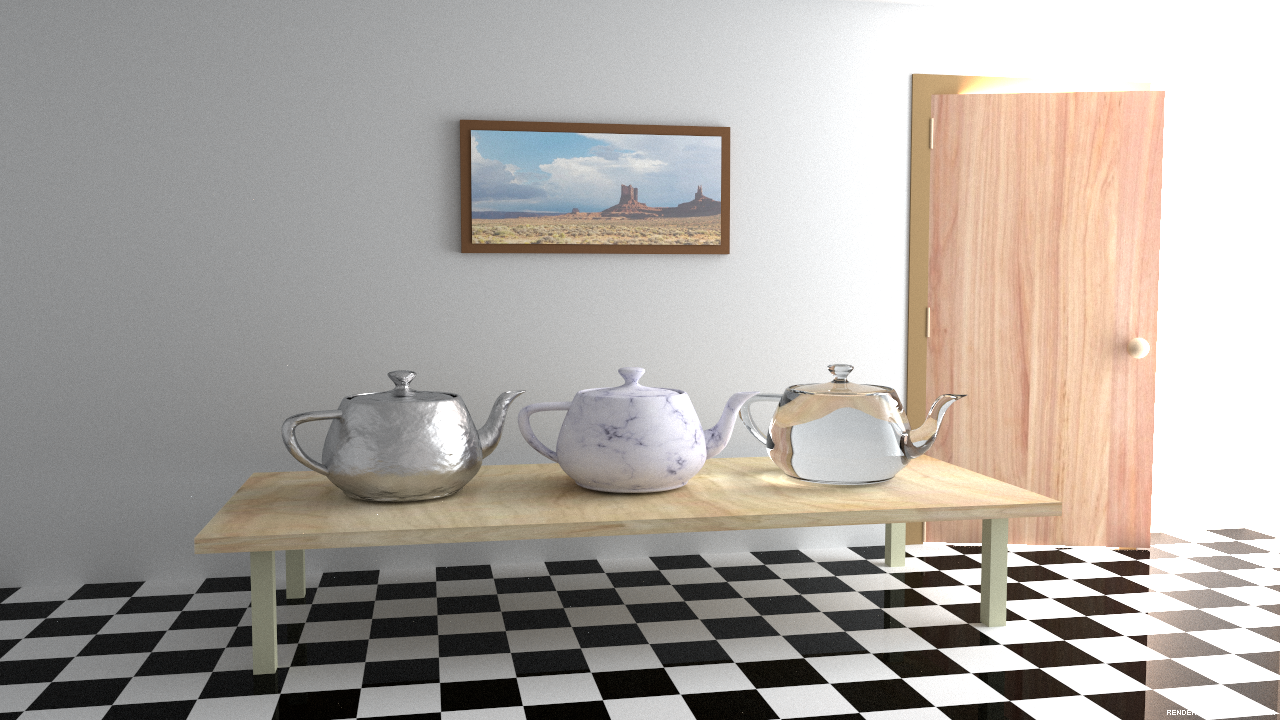 32000spp |
|---|
Veach-Door 256spp
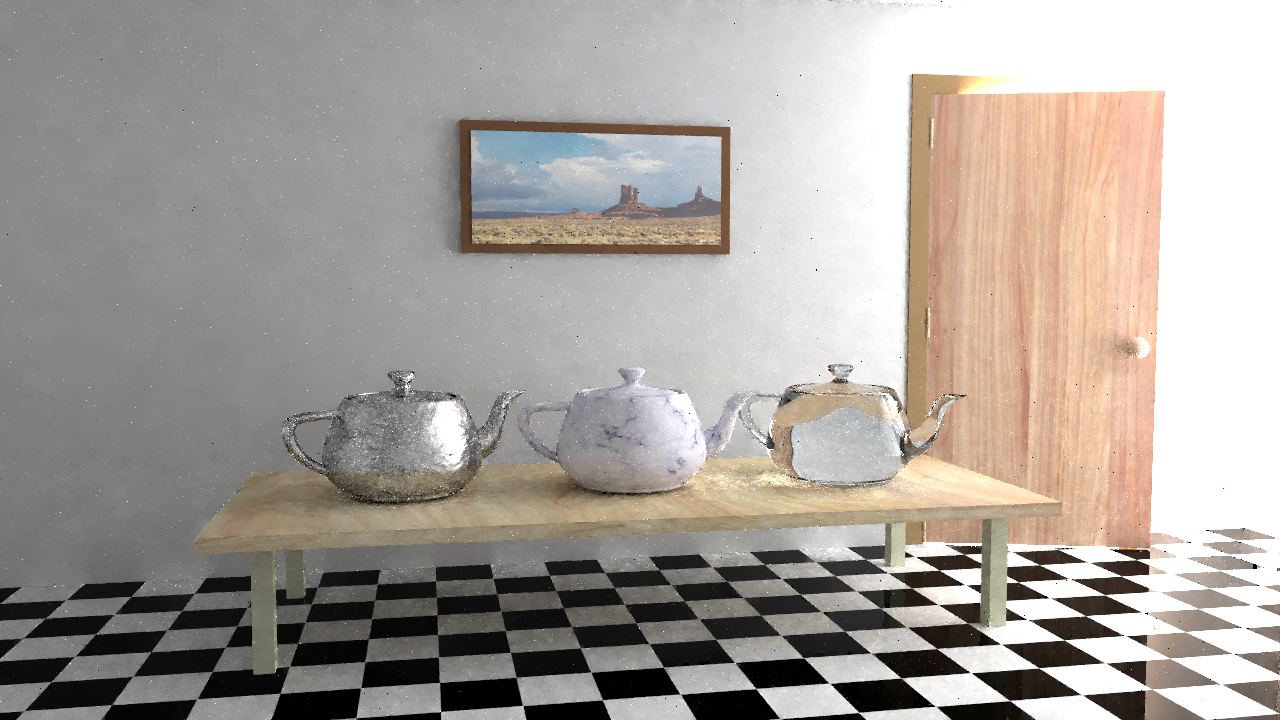
|
G-PT L1  relMSE: 0.021791 PT (512spp) 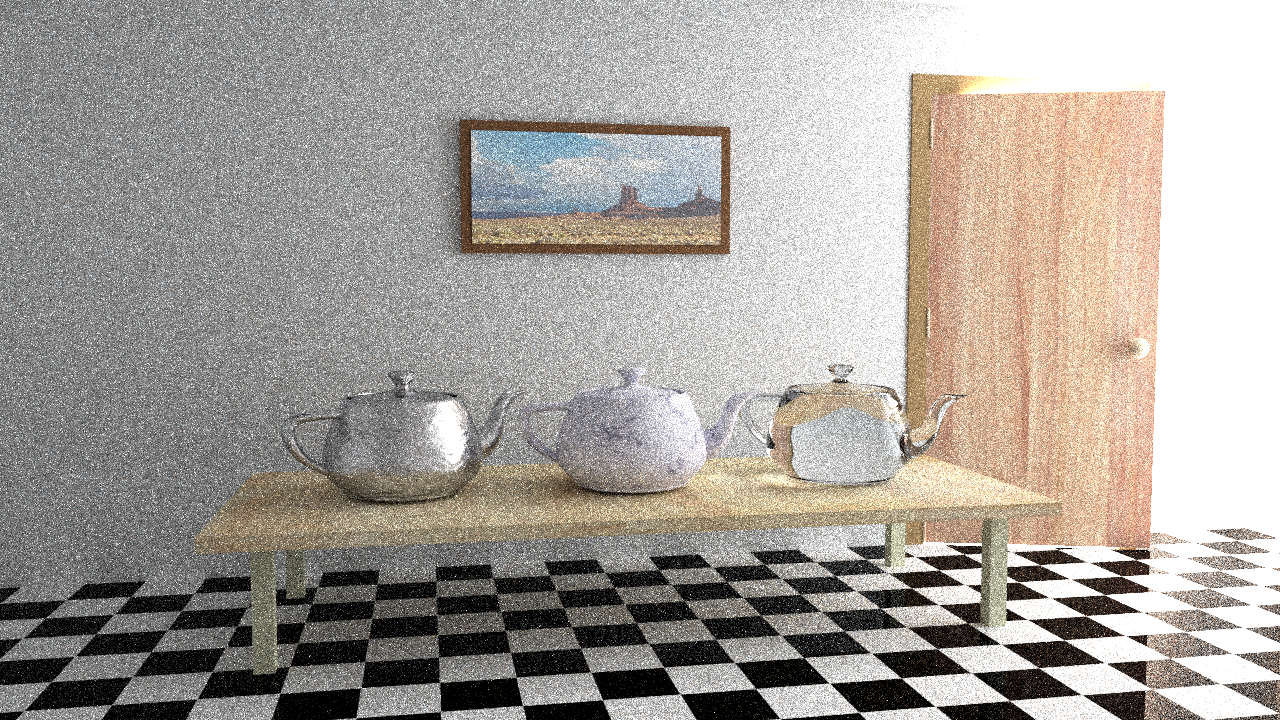 relMSE: 0.223310 |
G-PT L2 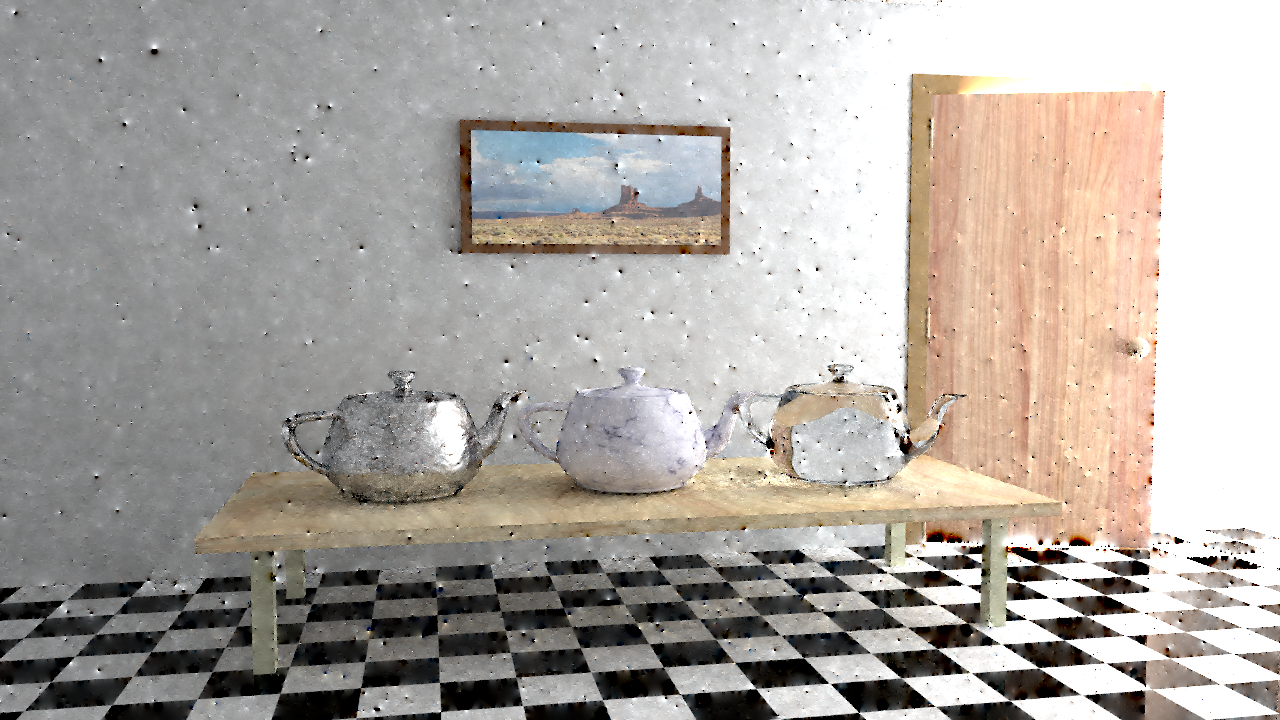 relMSE: 0.051629 Reference  32000spp |
|---|