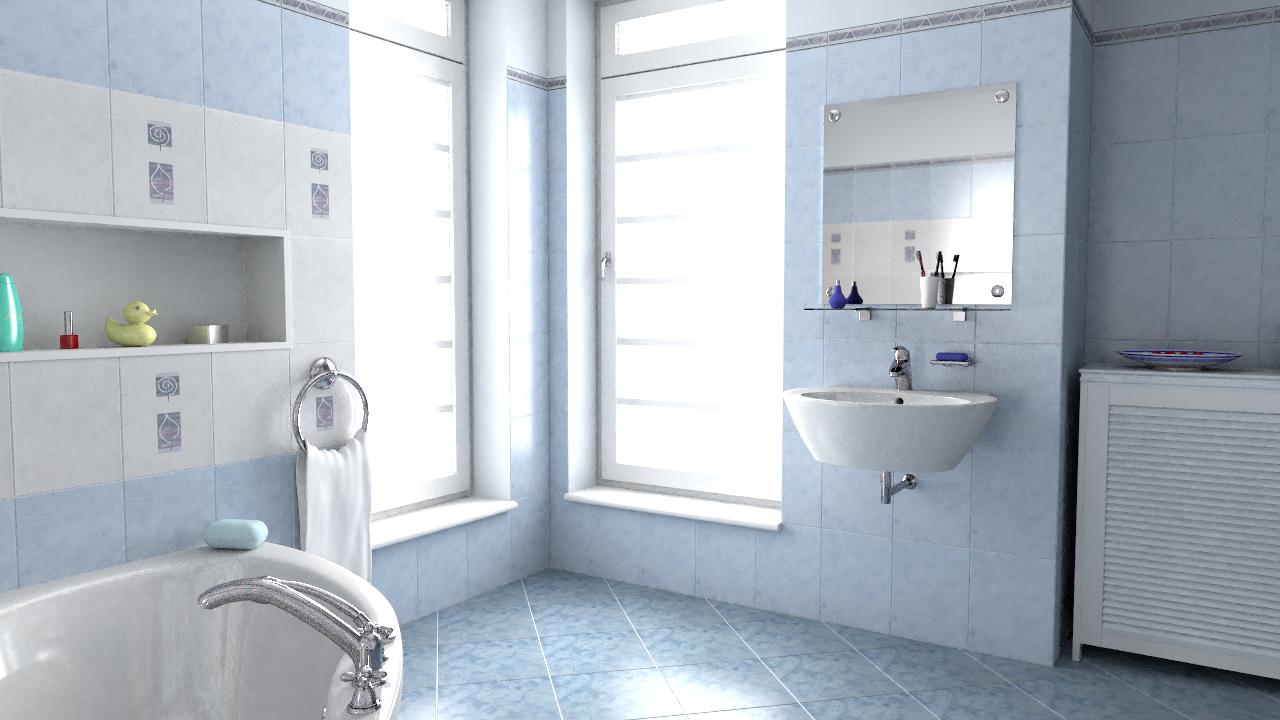
Bathroom 2048spp
|
G-PT L1 relMSE: 0.001984 PT (4096spp) 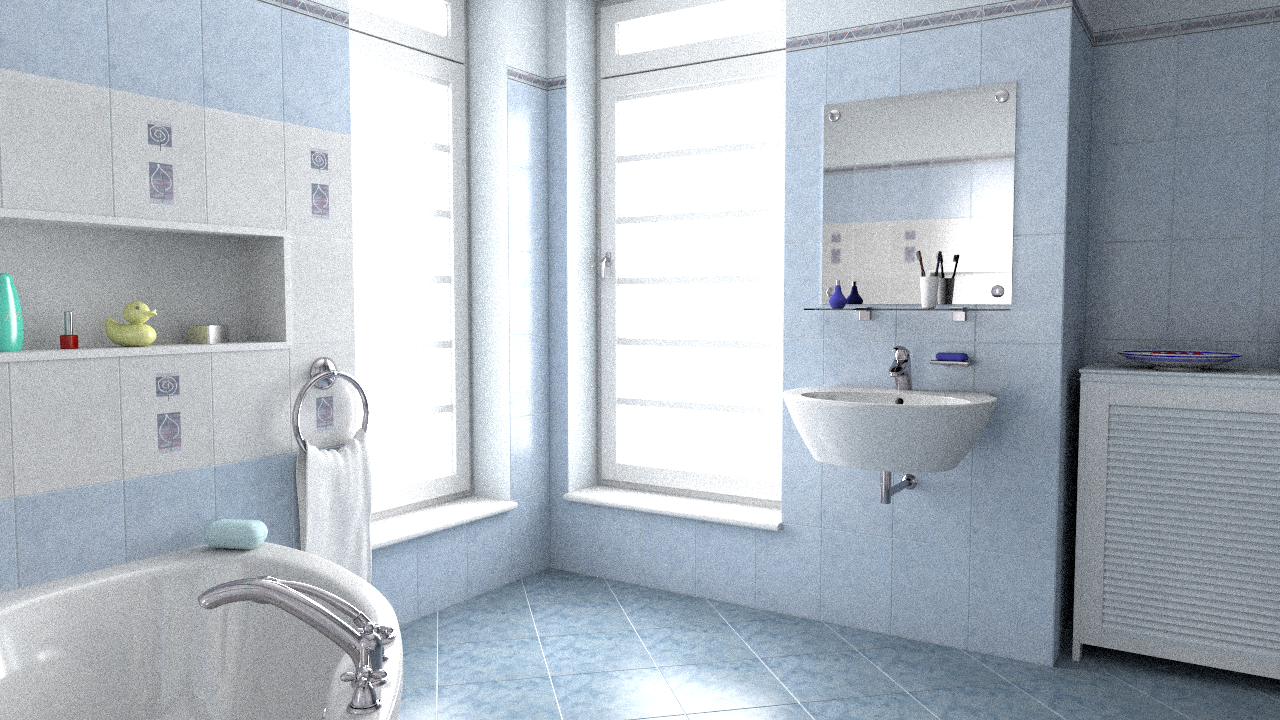 relMSE: 0.012299 |
G-PT L2 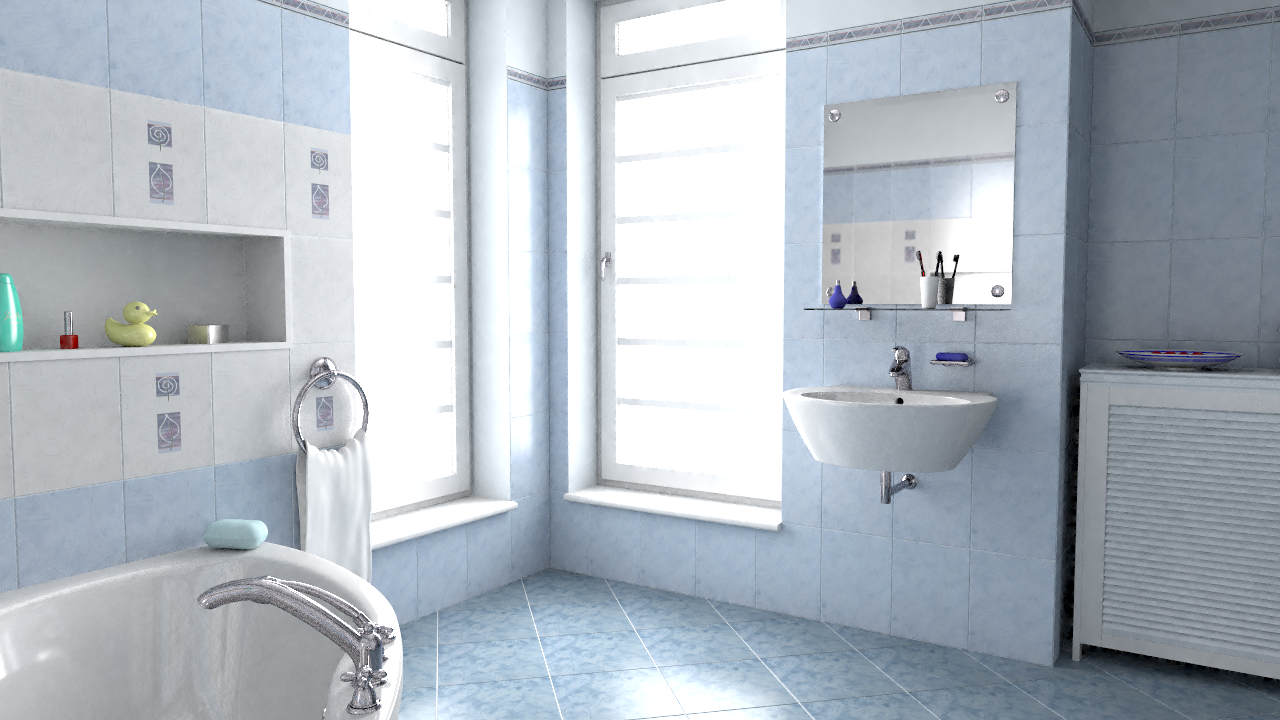 relMSE: 0.002107 Reference  40000spp |
|---|
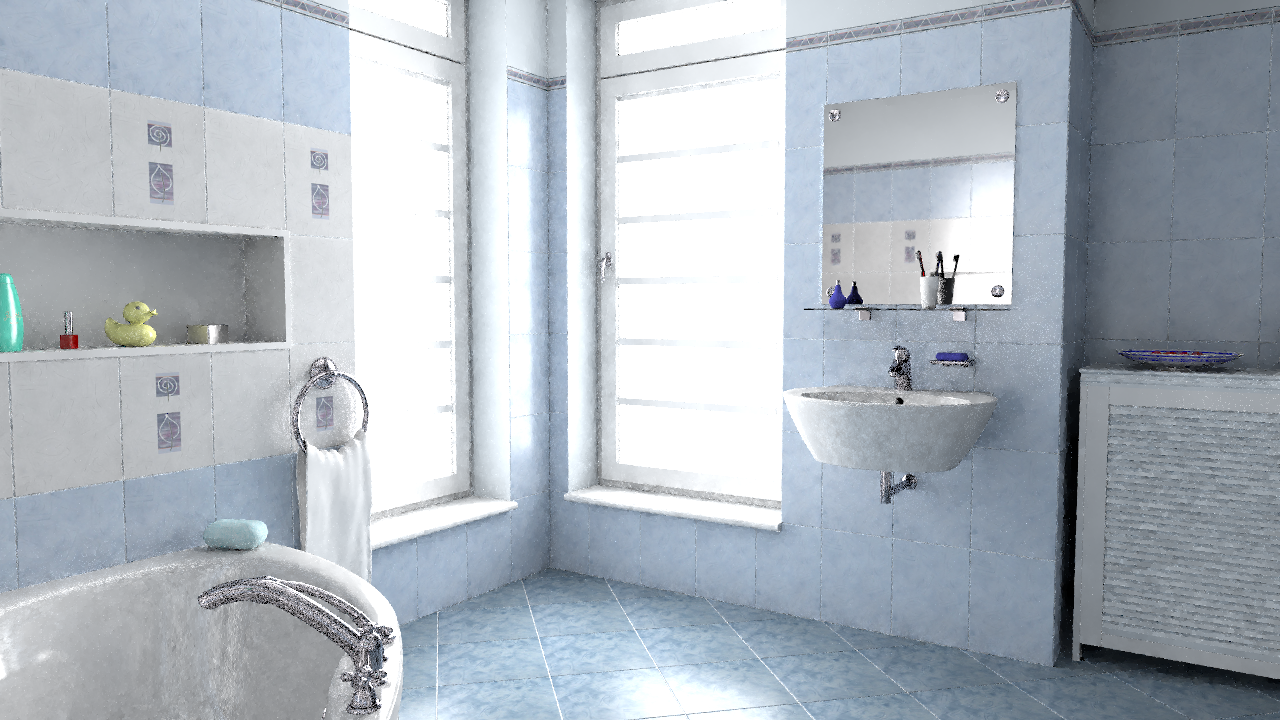
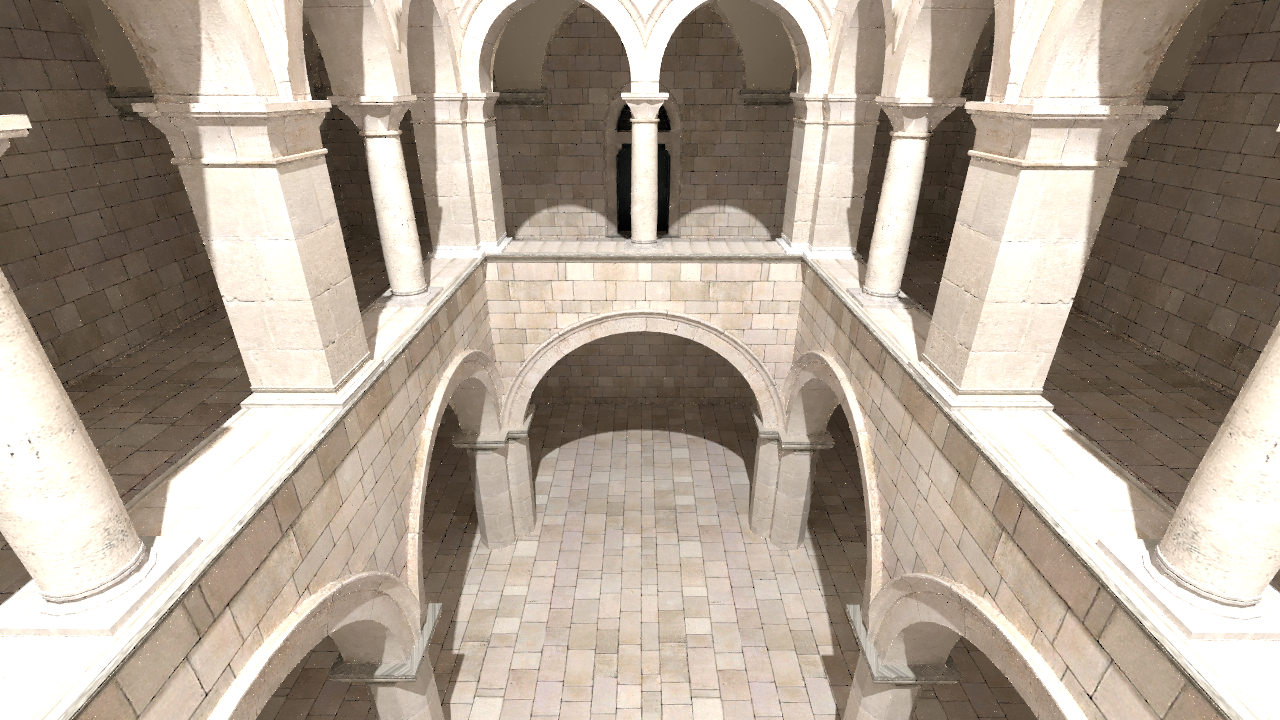
Bathroom 256spp
|
G-PT L1 relMSE: 0.009924 PT (512spp) 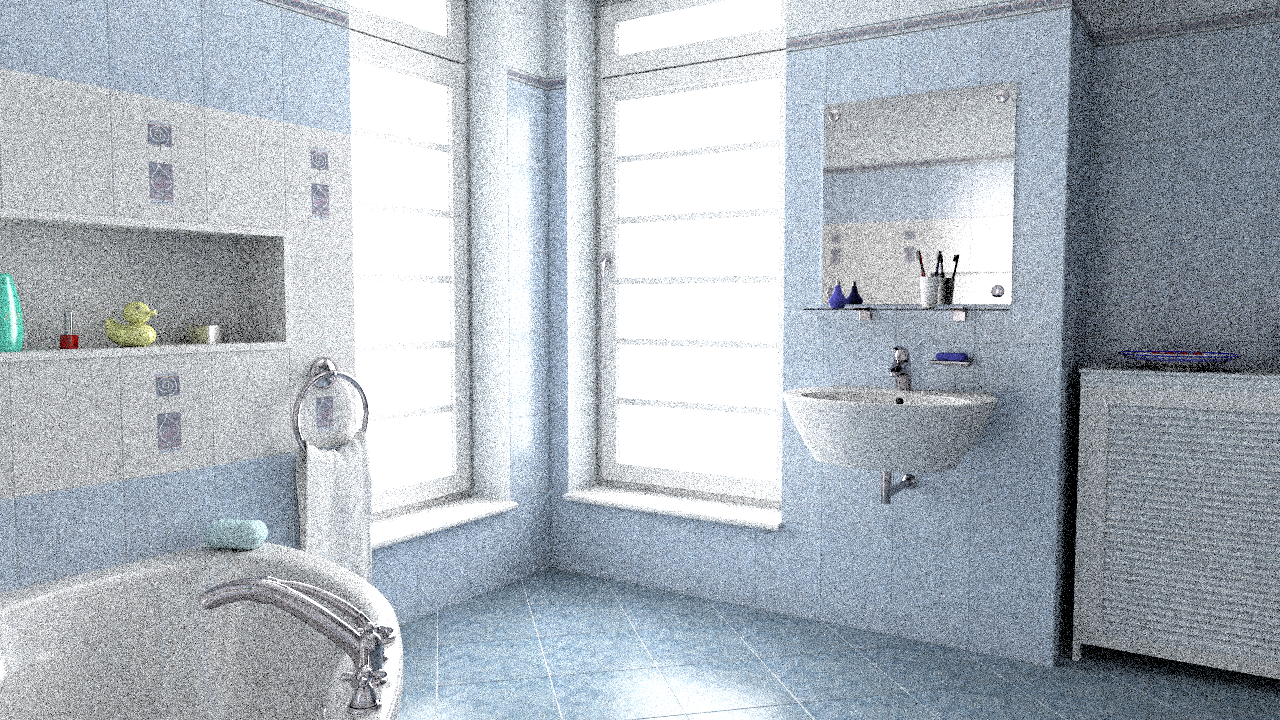 relMSE: 0.092130 |
G-PT L2  relMSE: 0.011004 Reference 40000spp |
|---|
Bookshelf 2048spp
|
G-PT L1 relMSE: 0.000582 PT (4096spp)  relMSE: 0.003673 |
G-PT L2  relMSE: 0.001090 Reference  18000spp |
|---|
Bookshelf 256spp

|
G-PT L1 relMSE: 0.003740 PT (512spp)  relMSE: 0.028595 |
G-PT L2  relMSE: 0.005819 Reference 18000spp |
|---|
Kitchen 2048spp

|
G-PT L1 relMSE: 0.001481 PT (4096spp)  relMSE: 0.006899 |
G-PT L2  relMSE: 0.001708 Reference  32000spp |
|---|
Kitchen 256spp
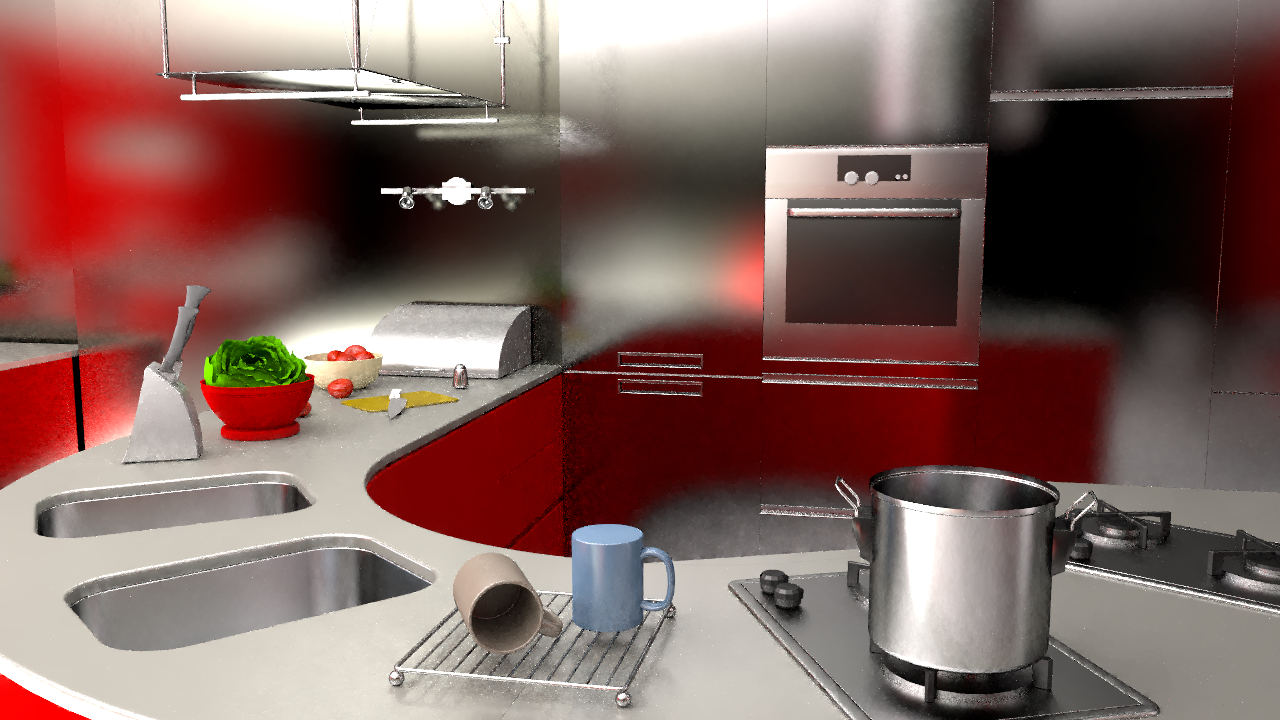
|
G-PT L1, 256spp relMSE: 0.007571 PT, 512spp  relMSE: 0.050493 |
G-PT L2, 256spp 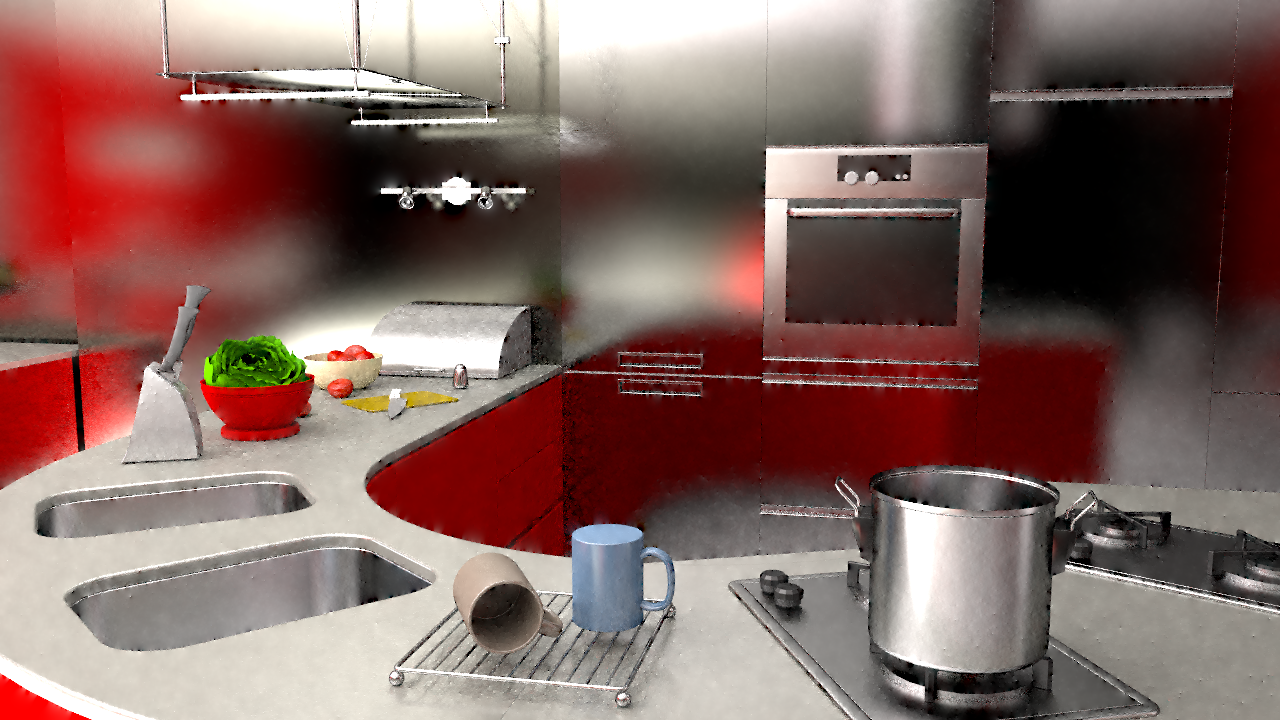 relMSE: 0.009003 Reference 32000spp |
|---|
Sponza 64spp
|
G-PT L1 relMSE: 0.000798 PT (128spp)  relMSE: 0.011806 |
G-PT L2  relMSE: 0.000872 Reference 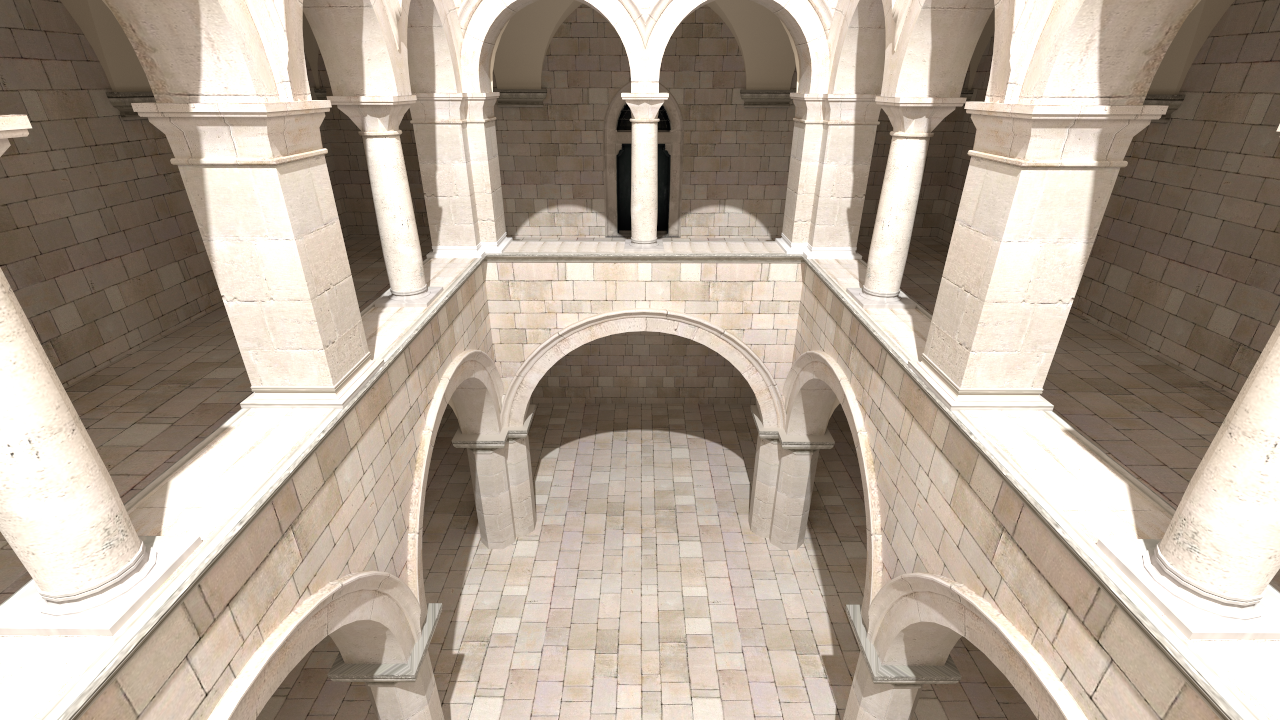 24000spp |
|---|
Sponza 8spp
|
G-PT L1 relMSE: 0.006781 PT (16spp)  relMSE: 0.093989 |
G-PT L2 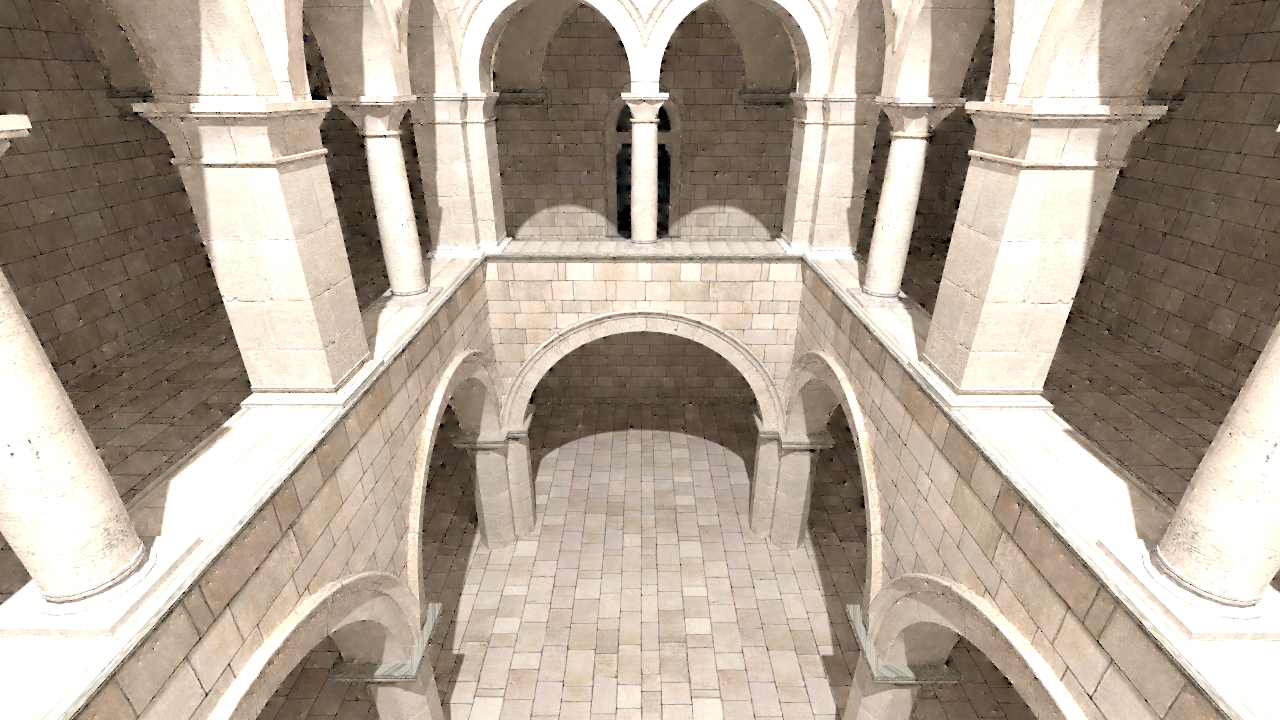 relMSE: 0.006588 Reference 24000spp |
|---|
Veach-Door 2048

|
G-PT L1 relMSE: 0.005791 PT (4096spp)  relMSE: 0.026903 |
G-PT L2  relMSE: 0.006503 Reference 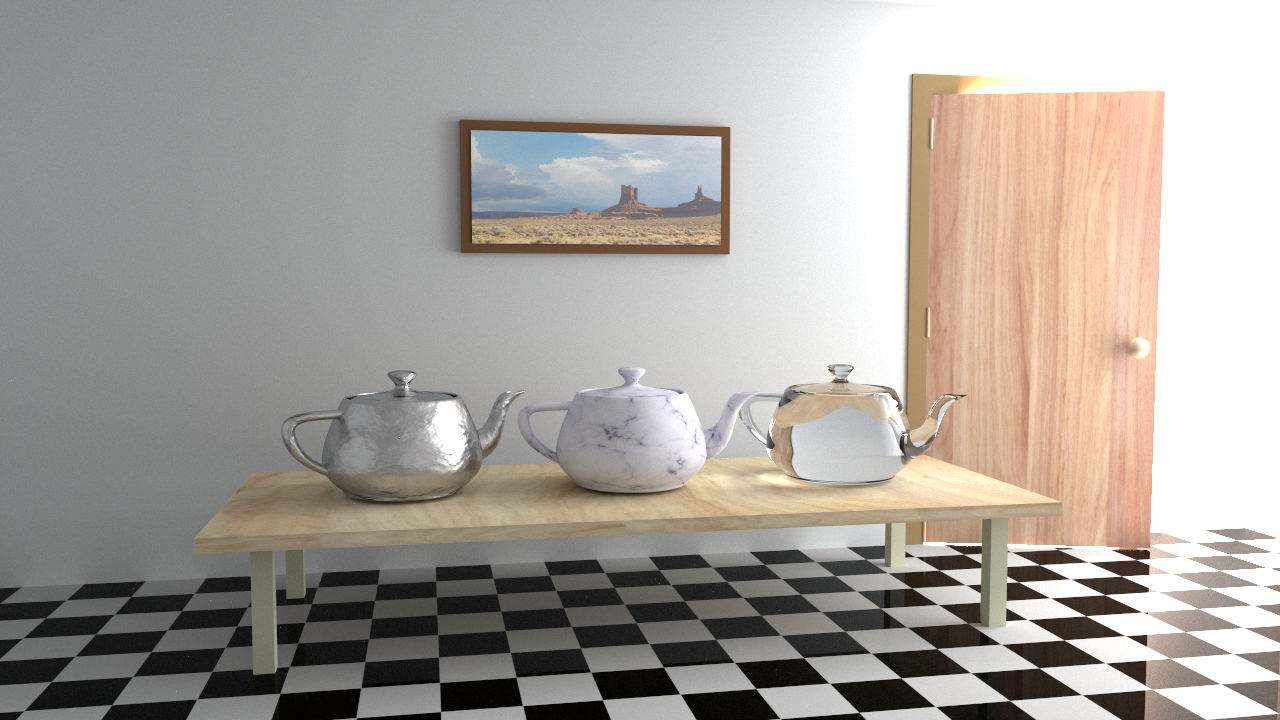 32000spp |
|---|
Veach-Door 256
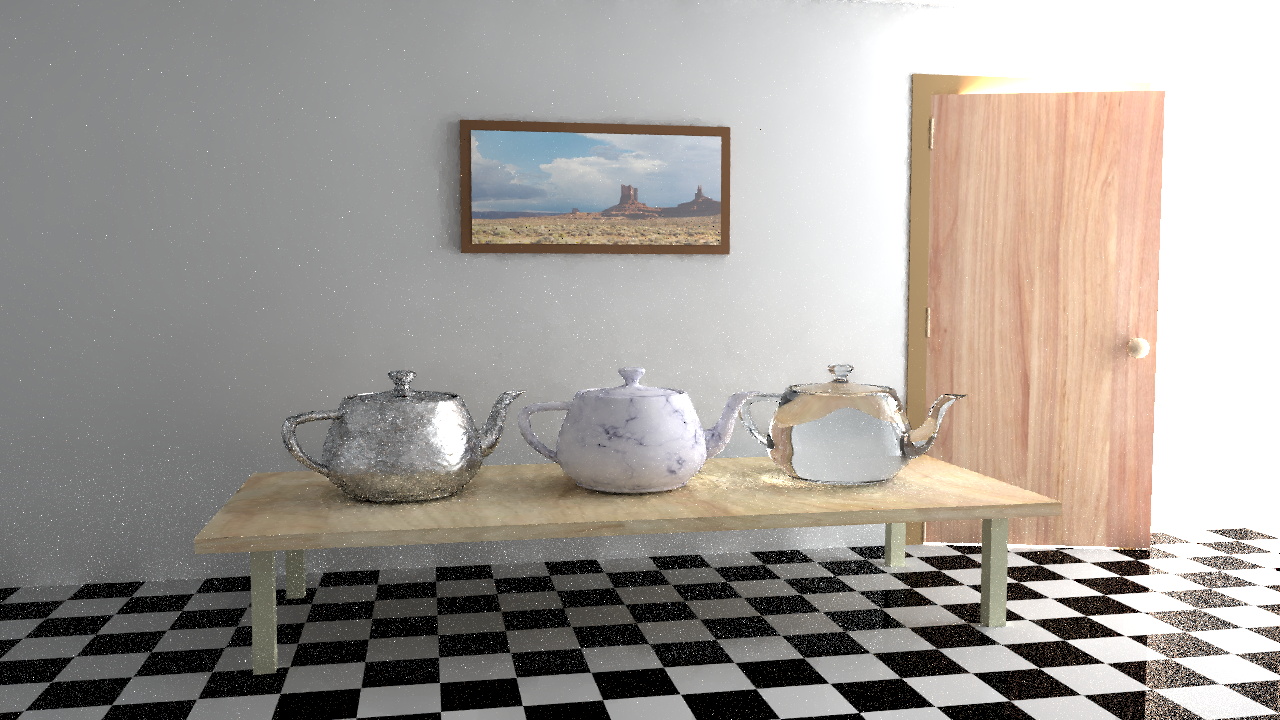
|
G-PT L1 relMSE: 0.043763 PT (512spp)  relMSE: 0.209632 |
G-PT L2  relMSE: 0.048758 Reference 32000spp |
|---|